Icahn Enterprises Activist Presentation Deck
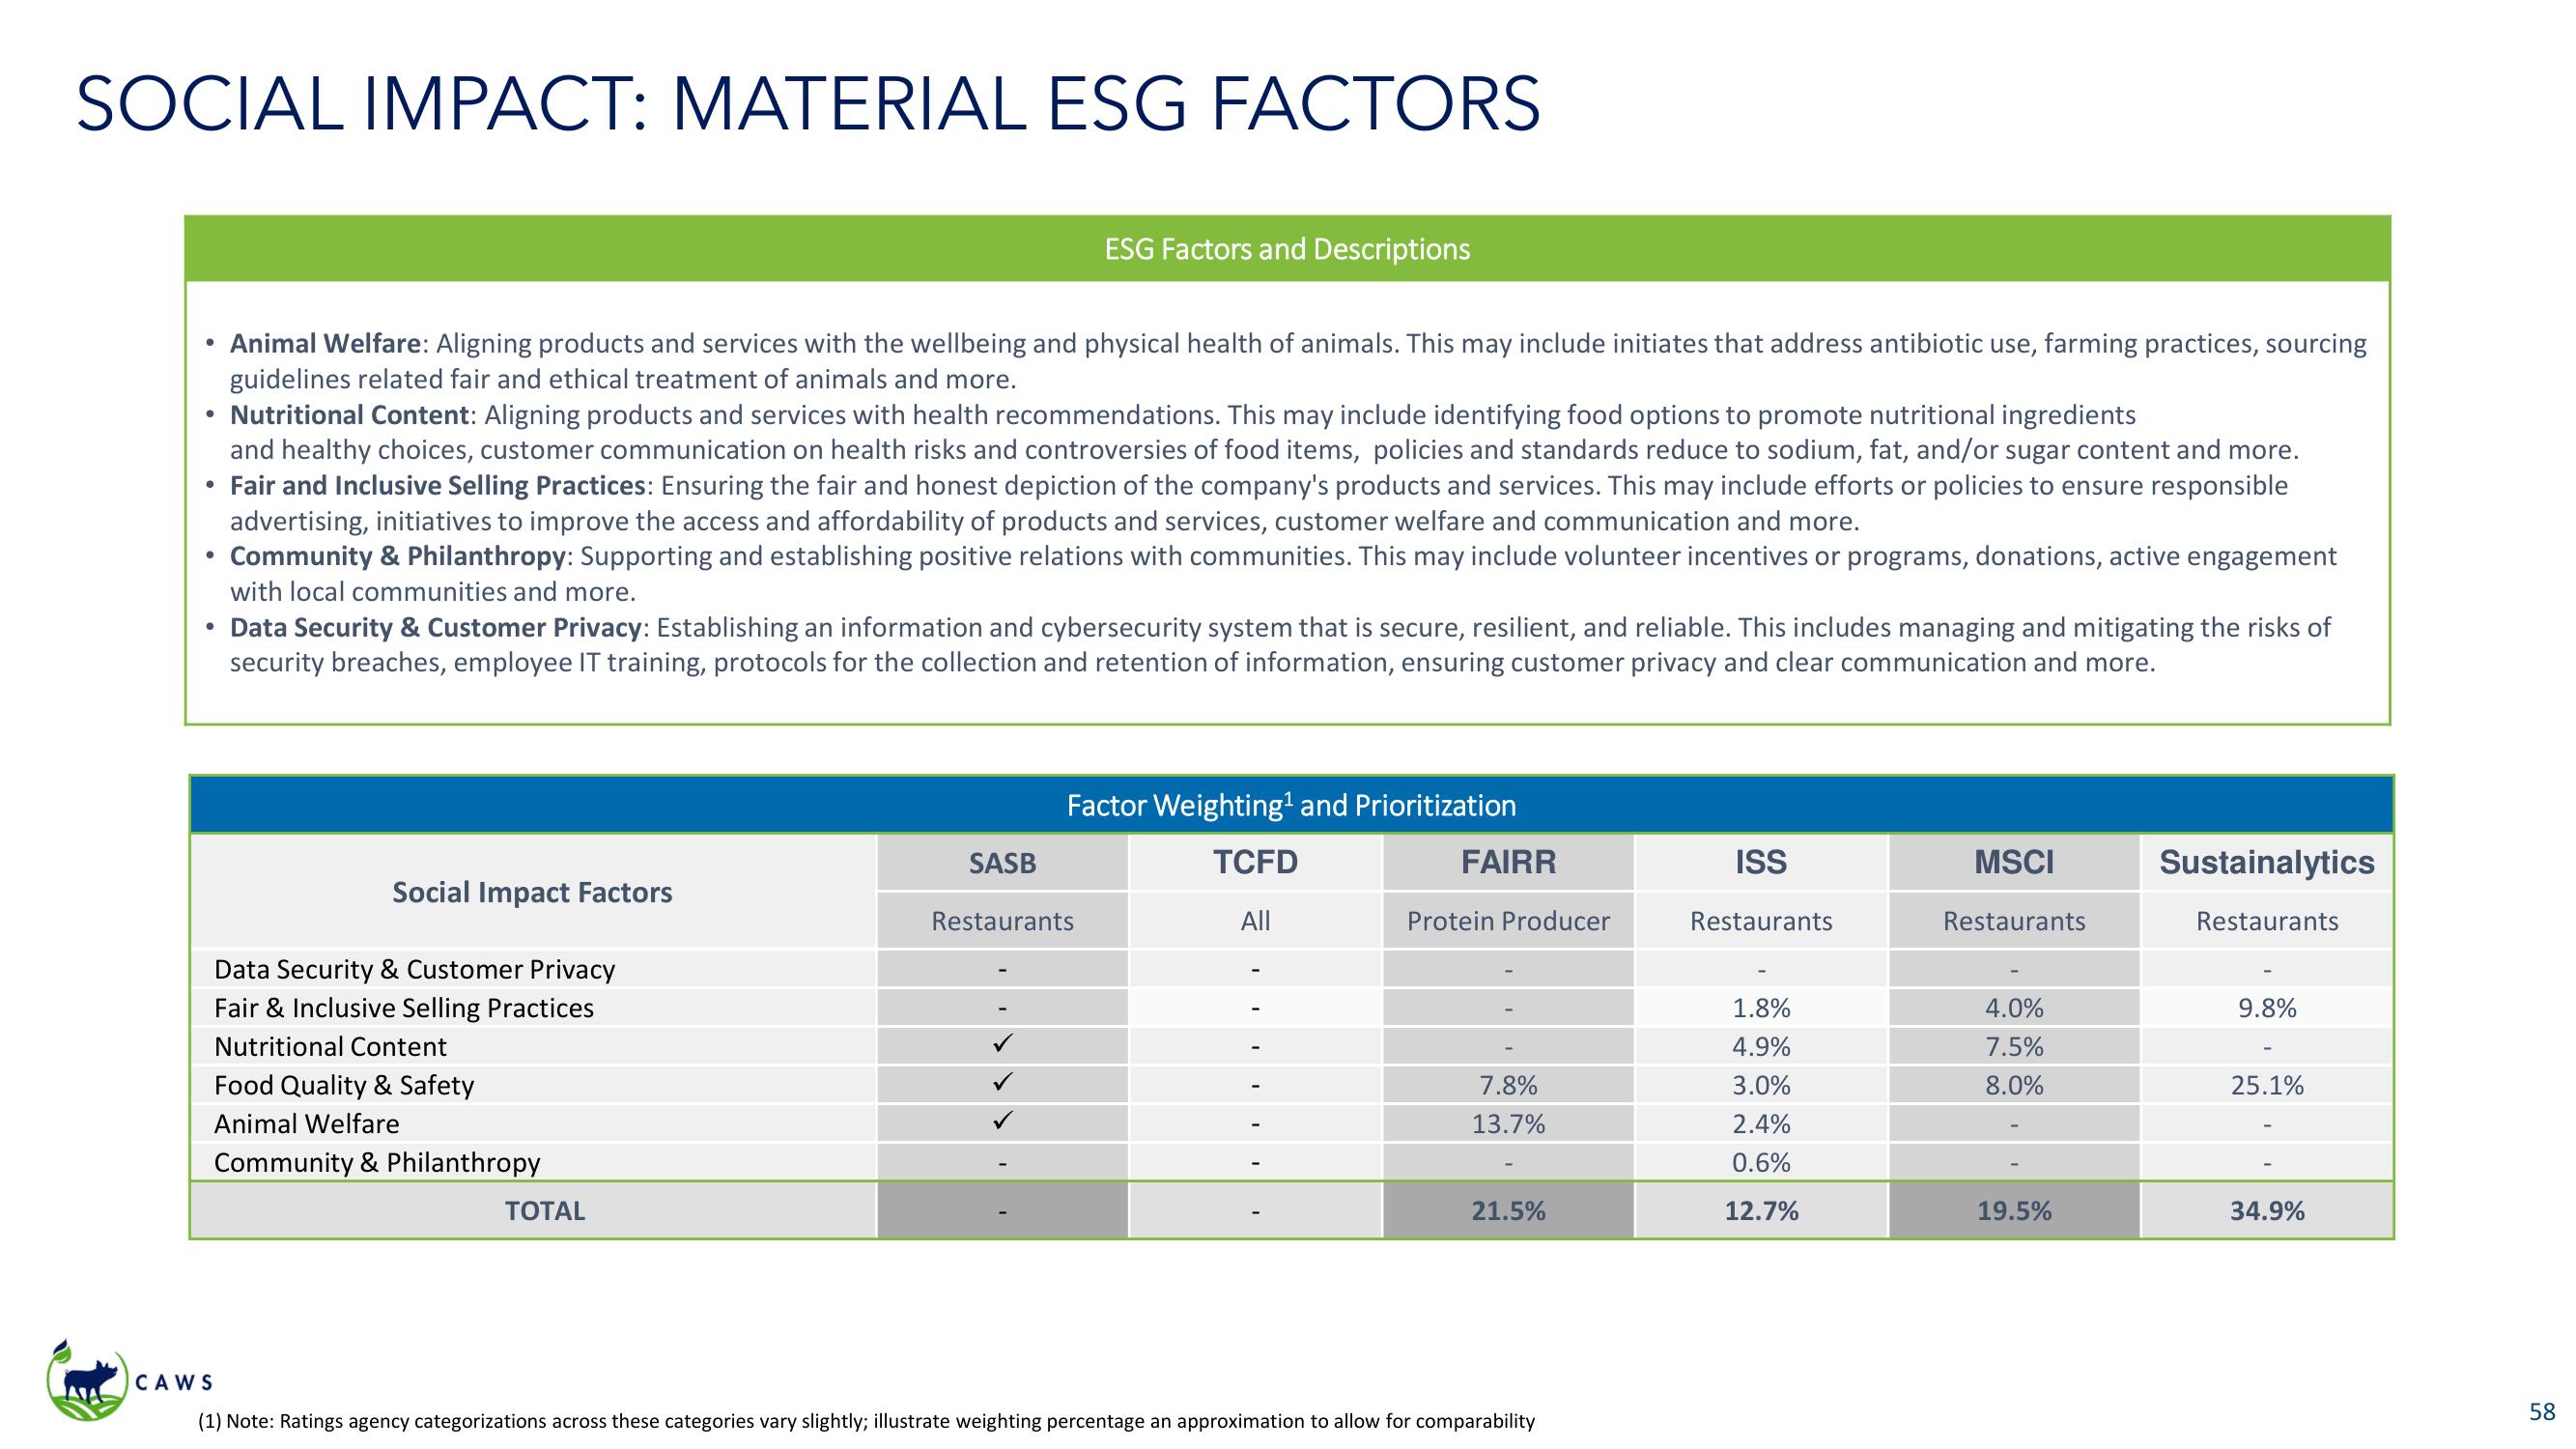
SOCIAL IMPACT: MATERIAL ESG FACTORS
• Animal Welfare: Aligning products and services with the wellbeing and physical health of animals. This may include initiates that address antibiotic use, farming practices, sourcing
guidelines related fair and ethical treatment of animals and more.
• Nutritional Content: Aligning products and services with health recommendations. This may include identifying food options to promote nutritional ingredients
and healthy choices, customer communication on health risks and controversies of food items, policies and standards reduce to sodium, fat, and/or sugar content and more.
• Fair and Inclusive Selling Practices: Ensuring the fair and honest depiction of the company's products and services. This may include efforts or policies to ensure responsible
advertising, initiatives to improve the access and affordability of products and services, customer welfare and communication and more.
• Community & Philanthropy: Supporting and establishing positive relations with communities. This may include volunteer incentives or programs, donations, active engagement
with local communities and more.
• Data Security & Customer Privacy: Establishing an information and cybersecurity system that is secure, resilient, and reliable. This includes managing and mitigating the risks of
security breaches, employee IT training, protocols for the collection and retention of information, ensuring customer privacy and clear communication and more.
CAWS
Social Impact Factors
Data Security & Customer Privacy
Fair & Inclusive Selling Practices
Nutritional Content
Food Quality & Safety
Animal Welfare
Community & Philanthropy
ESG Factors and Descriptions
TOTAL
SASB
Factor Weighting¹ and Prioritization
TCFD
All
Restaurants
▬▬▬▬▬▬▬
FAIRR
Protein Producer
7.8%
13.7%
21.5%
(1) Note: Ratings agency categorizations across these categories vary slightly; illustrate weighting percentage an approximation to allow for comparability
ISS
Restaurants
1.8%
4.9%
3.0%
2.4%
0.6%
12.7%
MSCI
Restaurants
4.0%
7.5%
8.0%
19.5%
Sustainalytics
Restaurants
9.8%
25.1%
34.9%
58View entire presentation