One Medical Investor Conference Presentation Deck
Appendix: GAAP to Non-GAAP Reconciliation
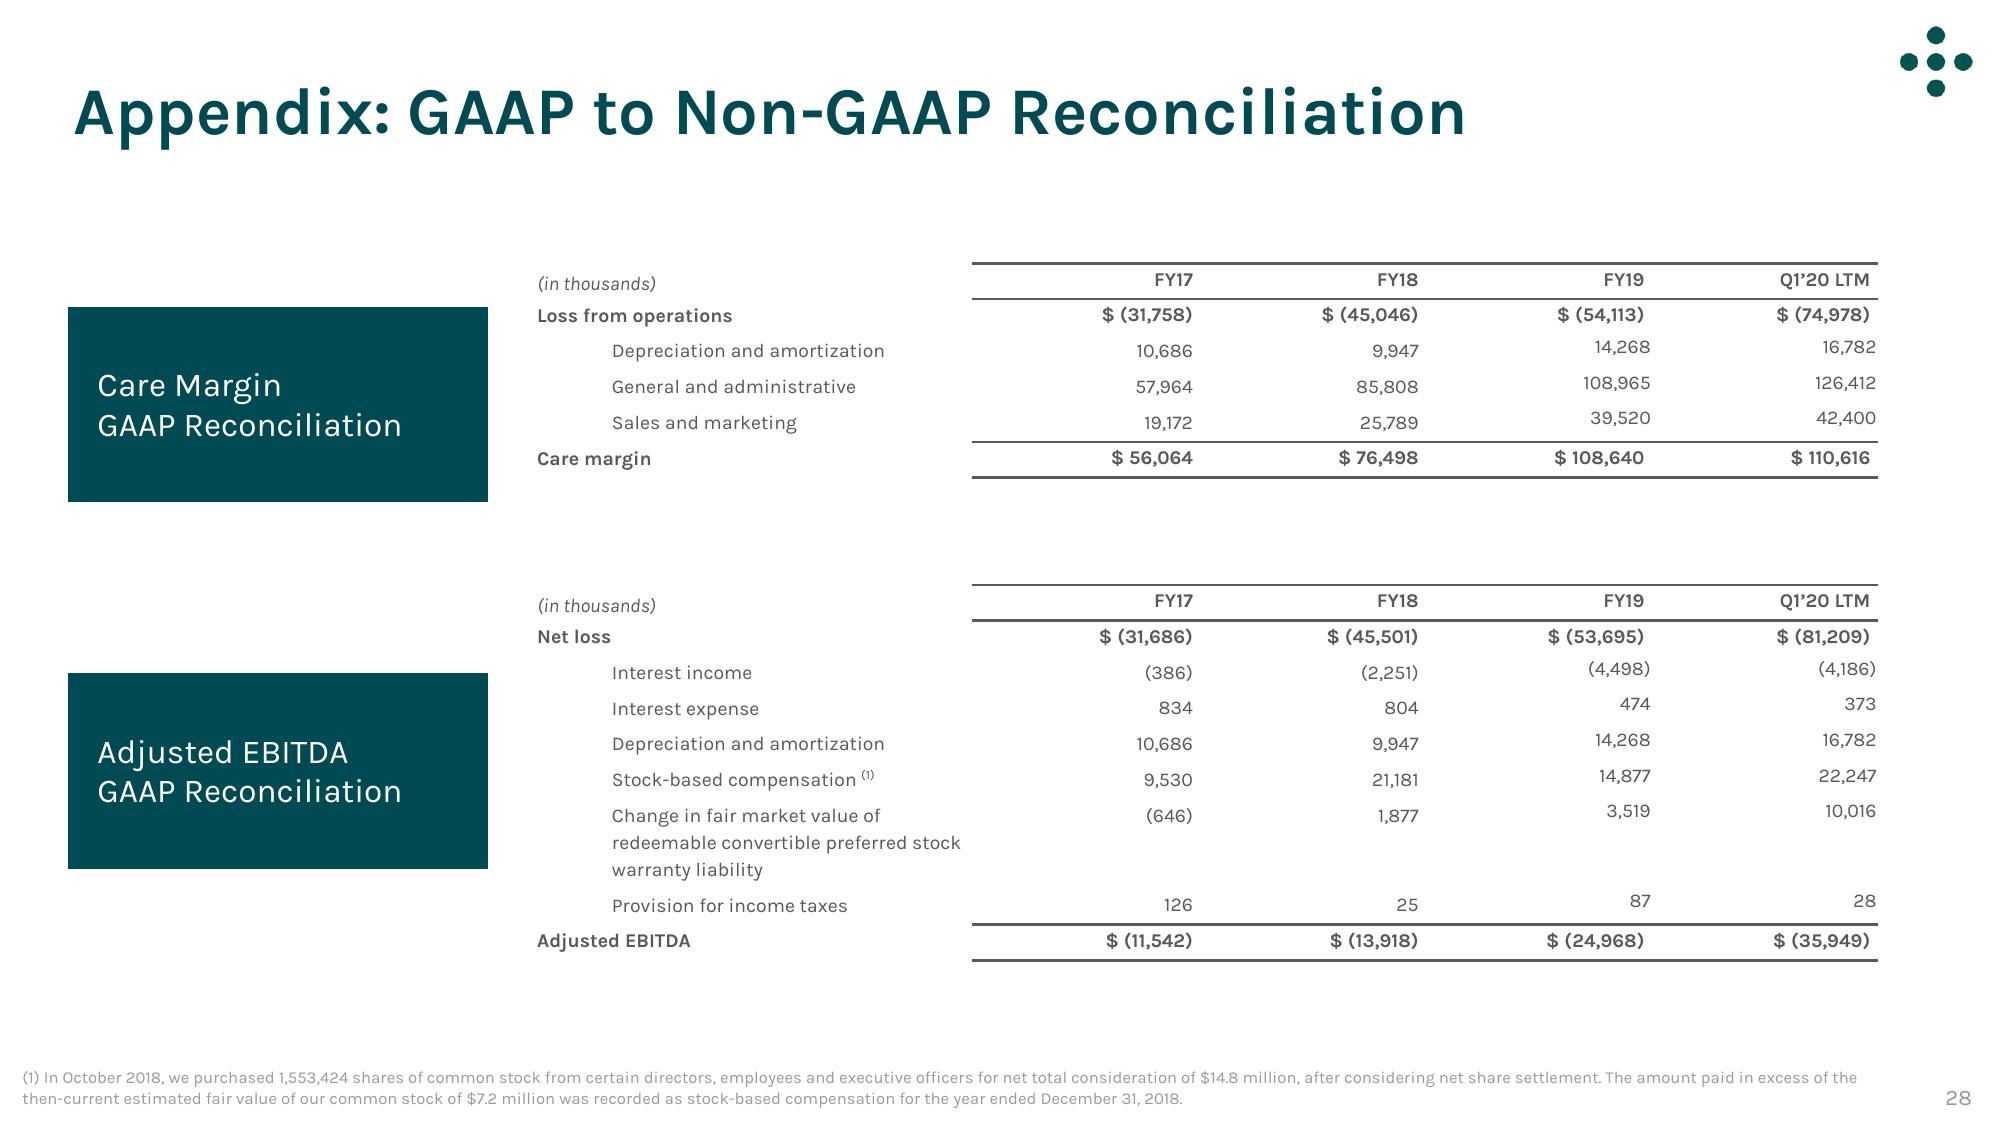
Care Margin
GAAP Reconciliation
Adjusted EBITDA
GAAP Reconciliation
(in thousands)
Loss from operations
Depreciation and amortization
General and administrative
Sales and marketing
Care margin
(in thousands)
Net loss
Interest income
Interest expense
Depreciation and amortization
Stock-based compensation (¹)
Change in fair market value of
redeemable convertible preferred stock
warranty liability
Provision for income taxes
Adjusted EBITDA
FY17
$ (31,758)
10,686
57,964
19,172
$ 56,064
FY17
$ (31,686)
(386)
834
10,686
9,530
(646)
126
$ (11,542)
FY18
$ (45,046)
9,947
85,808
25,789
$ 76,498
FY18
$ (45,501)
(2,251)
804
9,947
21,181
1,877
25
$ (13,918)
FY19
$ (54,113)
14,268
108,965
39,520
$ 108,640
FY19
$ (53,695)
(4,498)
474
14,268
14,877
3,519
87
$ (24,968)
Q1'20 LTM
$ (74,978)
16,782
126,412
42,400
$ 110,616
Q1'20 LTM
$ (81,209)
(4,186)
373
16,782
22,247
10,016
28
$ (35,949)
(1) In October 2018, we purchased 1,553,424 shares of common stock from certain directors, employees and executive officers for net total consideration of $14.8 million, after considering net share settlement. The amount paid in excess of the
then-current estimated fair value of our common stock of $7.2 million was recorded as stock-based compensation for the year ended December 31, 2018.
.:.
28View entire presentation