Azure Power Investor Presentation
Review of Q2 FY'21 Results
(in million)
Reported
2Q FY'20
INR
Reported
2Q FY'21
INR
Reported
2Q FY'21
US$
2Q FY'21 After
% Change
Adjustments*
US$
Adjustments
Adjusted Q2FY'21 vs
US$
Q2FY'20
Revenue
2,847
3,504
47.6
47.6
23%
Cost of Operations
253
309
4.2
Comments
Azure Power
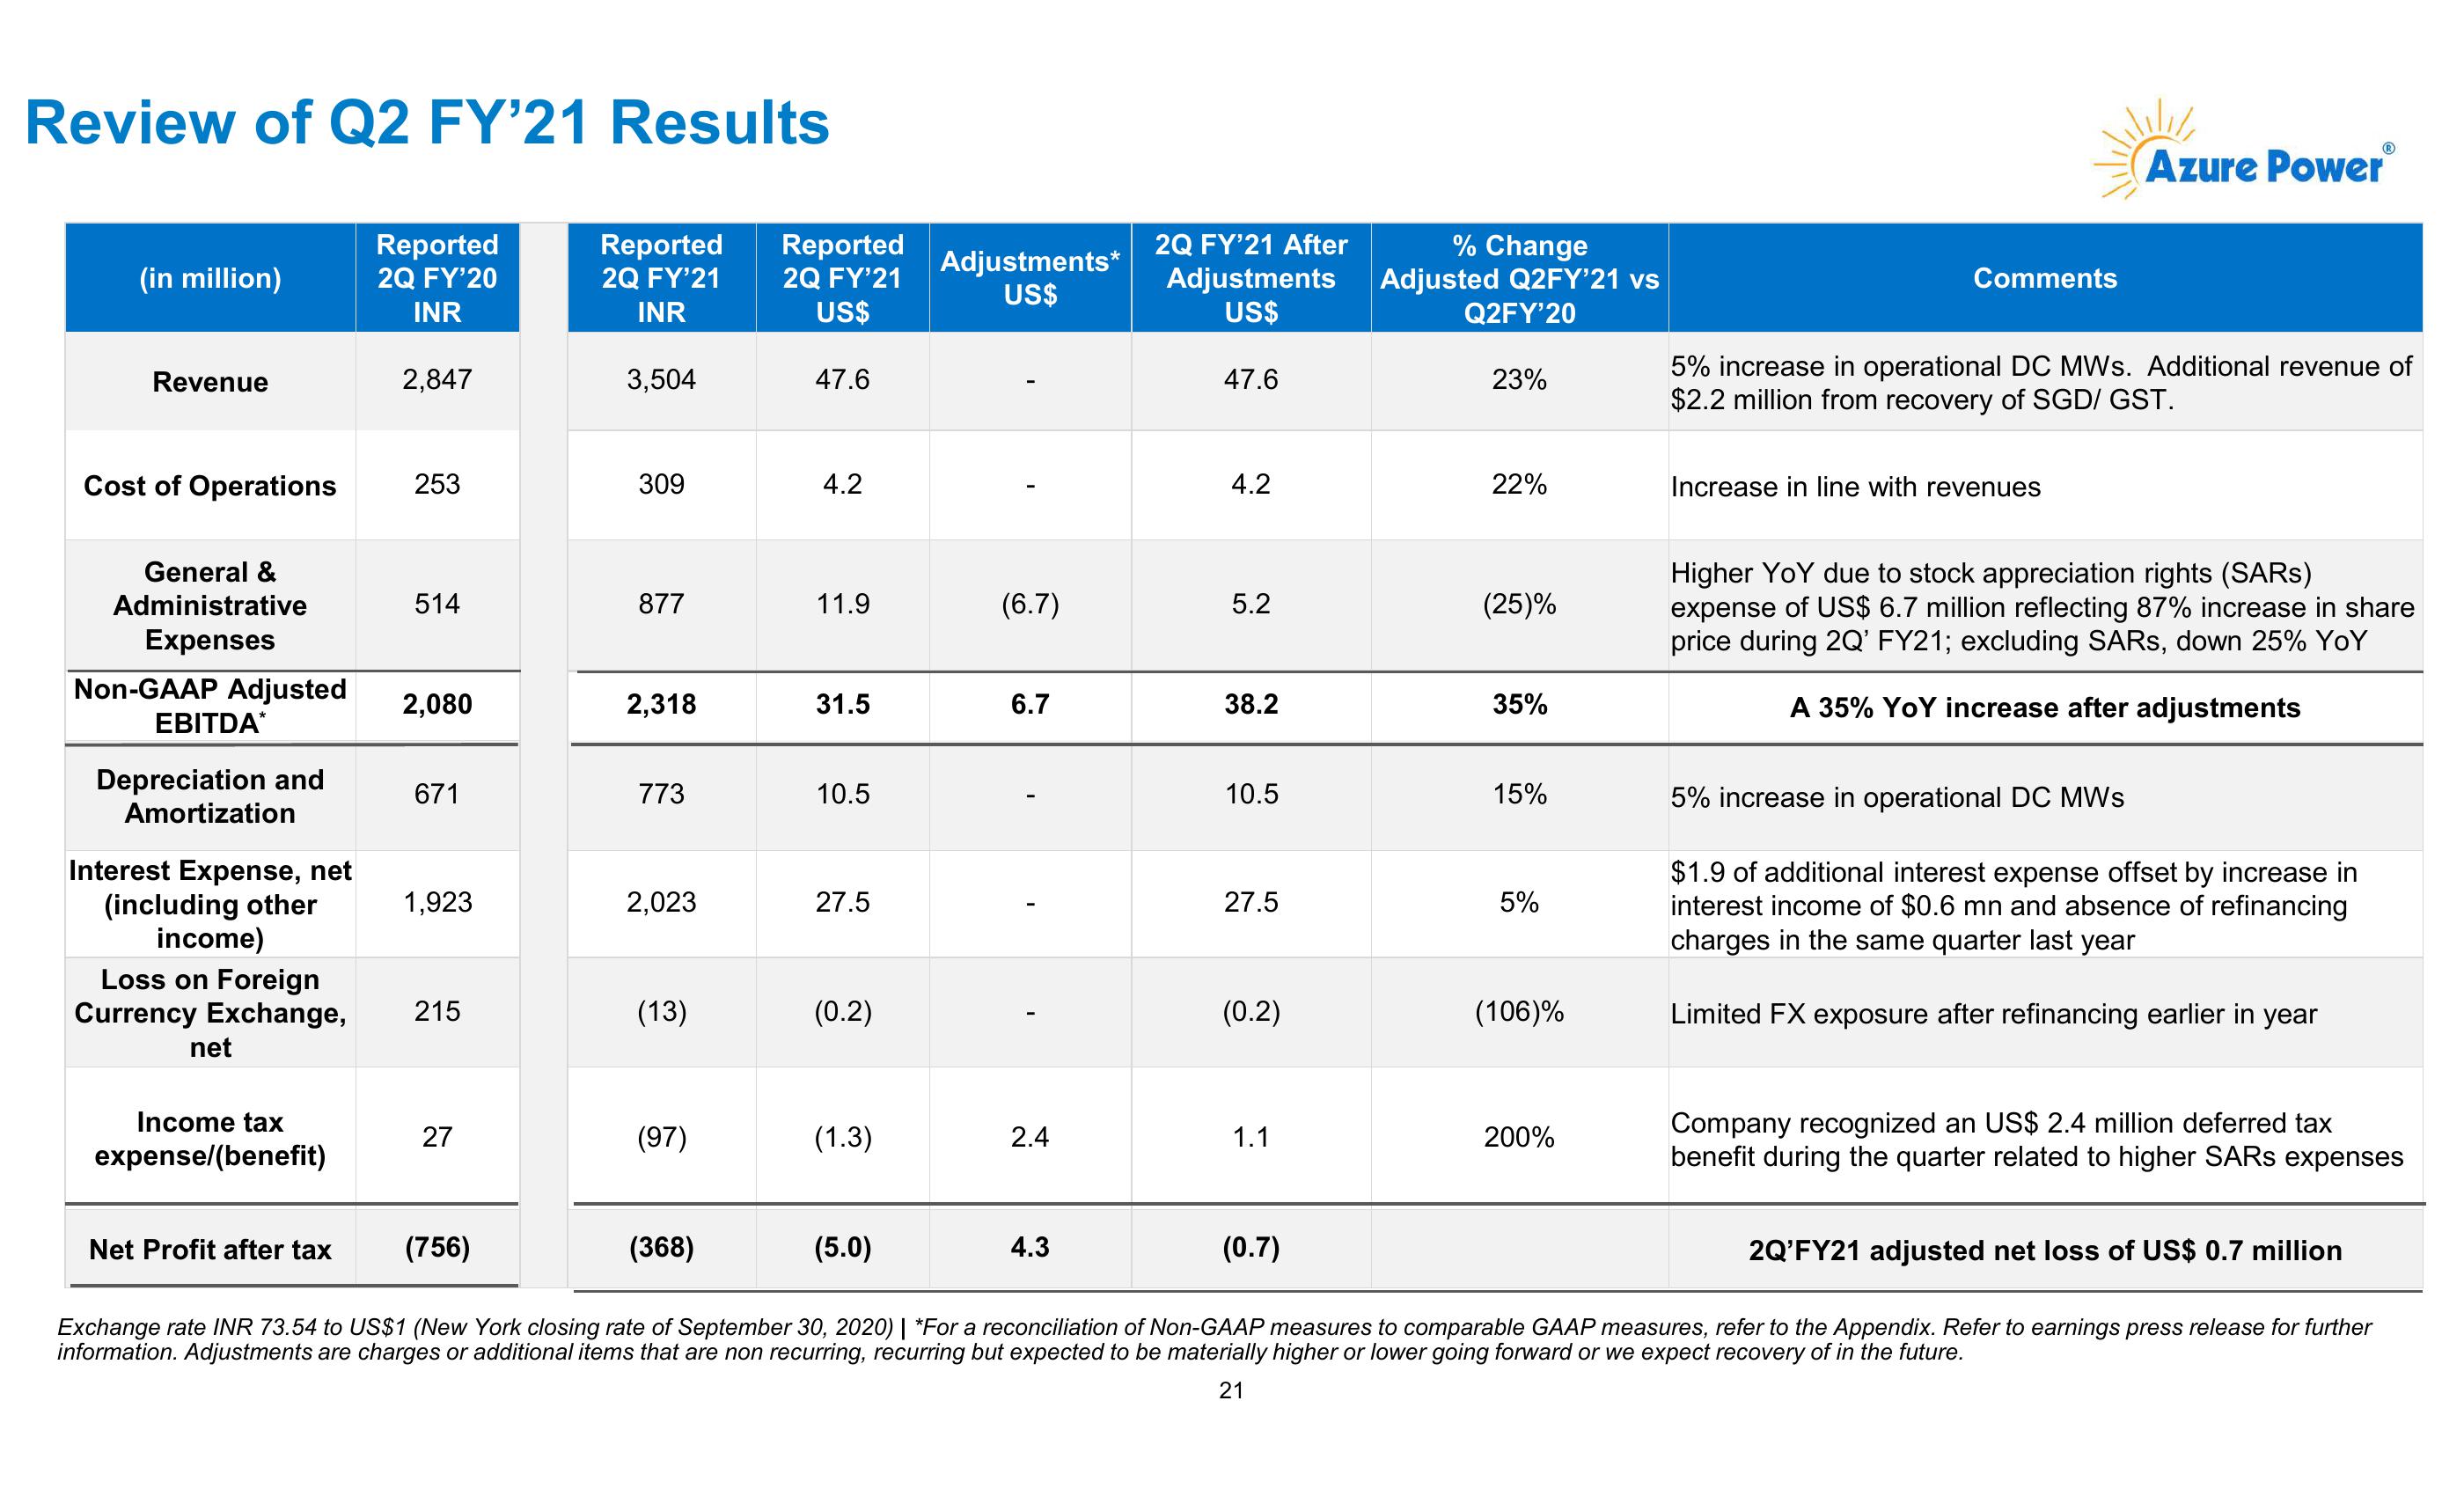
5% increase in operational DC MWs. Additional revenue of
$2.2 million from recovery of SGD/ GST.
4.2
22%
Increase in line with revenues
General &
Administrative
514
877
11.9
(6.7)
5.2
(25)%
Expenses
Non-GAAP Adjusted
2,080
2,318
31.5
6.7
38.2
35%
EBITDA*
Depreciation and
671
773
10.5
10.5
15%
Amortization
Interest Expense, net
(including other
1,923
2,023
27.5
27.5
5%
income)
Higher YoY due to stock appreciation rights (SARS)
expense of US$ 6.7 million reflecting 87% increase in share
price during 2Q' FY21; excluding SARS, down 25% YoY
A 35% YoY increase after adjustments
5% increase in operational DC MWs
$1.9 of additional interest expense offset by increase in
interest income of $0.6 mn and absence of refinancing
charges in the same quarter last year
Loss on Foreign
Currency Exchange,
215
(13)
(0.2)
(0.2)
(106)%
Limited FX exposure after refinancing earlier in year
net
Income tax
expense/(benefit)
27
(97)
(1.3)
2.4
1.1
200%
Net Profit after tax
(756)
(368)
(5.0)
4.3
(0.7)
Company recognized an US$ 2.4 million deferred tax
benefit during the quarter related to higher SARS expenses
2Q'FY21 adjusted net loss of US$ 0.7 million
Exchange rate INR 73.54 to US$1 (New York closing rate of September 30, 2020) | *For a reconciliation of Non-GAAP measures to comparable GAAP measures, refer to the Appendix. Refer to earnings press release for further
information. Adjustments are charges or additional items that are non recurring, recurring but expected to be materially higher or lower going forward or we expect recovery of in the future.
21View entire presentation