Pathward Financial Results Presentation Deck
HEALTHY BALANCE SHEET WITH ROBUST PAYMENT
DEPOSIT GROWTH
FIRST QUARTER ENDED DECEMBER 31, 2020
LO
5
BALANCE SHEET
($ in thousands)
Loans and leases
Allowance
Total assets
Noninterest-bearing checking
Total deposits
Total liabilities
Total stockholders' equity
Total liabilities and stockholders equity
for credit losses
Loans / Deposits
Net Interest Margin
Return on Average Assets
Return on Average Equity
●
●
●
$
$
1021
3,448,675
(72,389)
7,264,515
5,581,597
6,207,791
6,451,305
813,210
7,264,515
56 %
4.65 %
1.73 %
13.91 %
$
$
PERIOD ENDING
4Q20
3,322,765
(56,188)
6,092,074
4,356,630
4,979,200
5,244,766
847,308
6,092,074
67%
3.77 %
0.69 %
6.21 %
$
$
1Q20
3,590,474
(30,176)
6,180,926
2,927,967
4,517,605
5,343,858
837,068
6,180,926
79 %
4.94 %
1.38 %
10.04 %
$
$
AVERAGE
1021
3,341,023
(72,252)
6,481,823
4,880,314
5,426,443
5,675,676
806,147
6,481,823
62 %
4.65 %
1.73 %
13.91 %
QUARTERLY INVESTOR UPDATE | FIRST QUARTER FISCAL YEAR 2021 | NASDAQ: CASH
$
$
1Q20
3,601,302
(28,853)
6,122,504
2,717,346
4,481,158
5,283,173
839,331
6,122,504
80 %
4.94 %
1.38 %
10.04 %
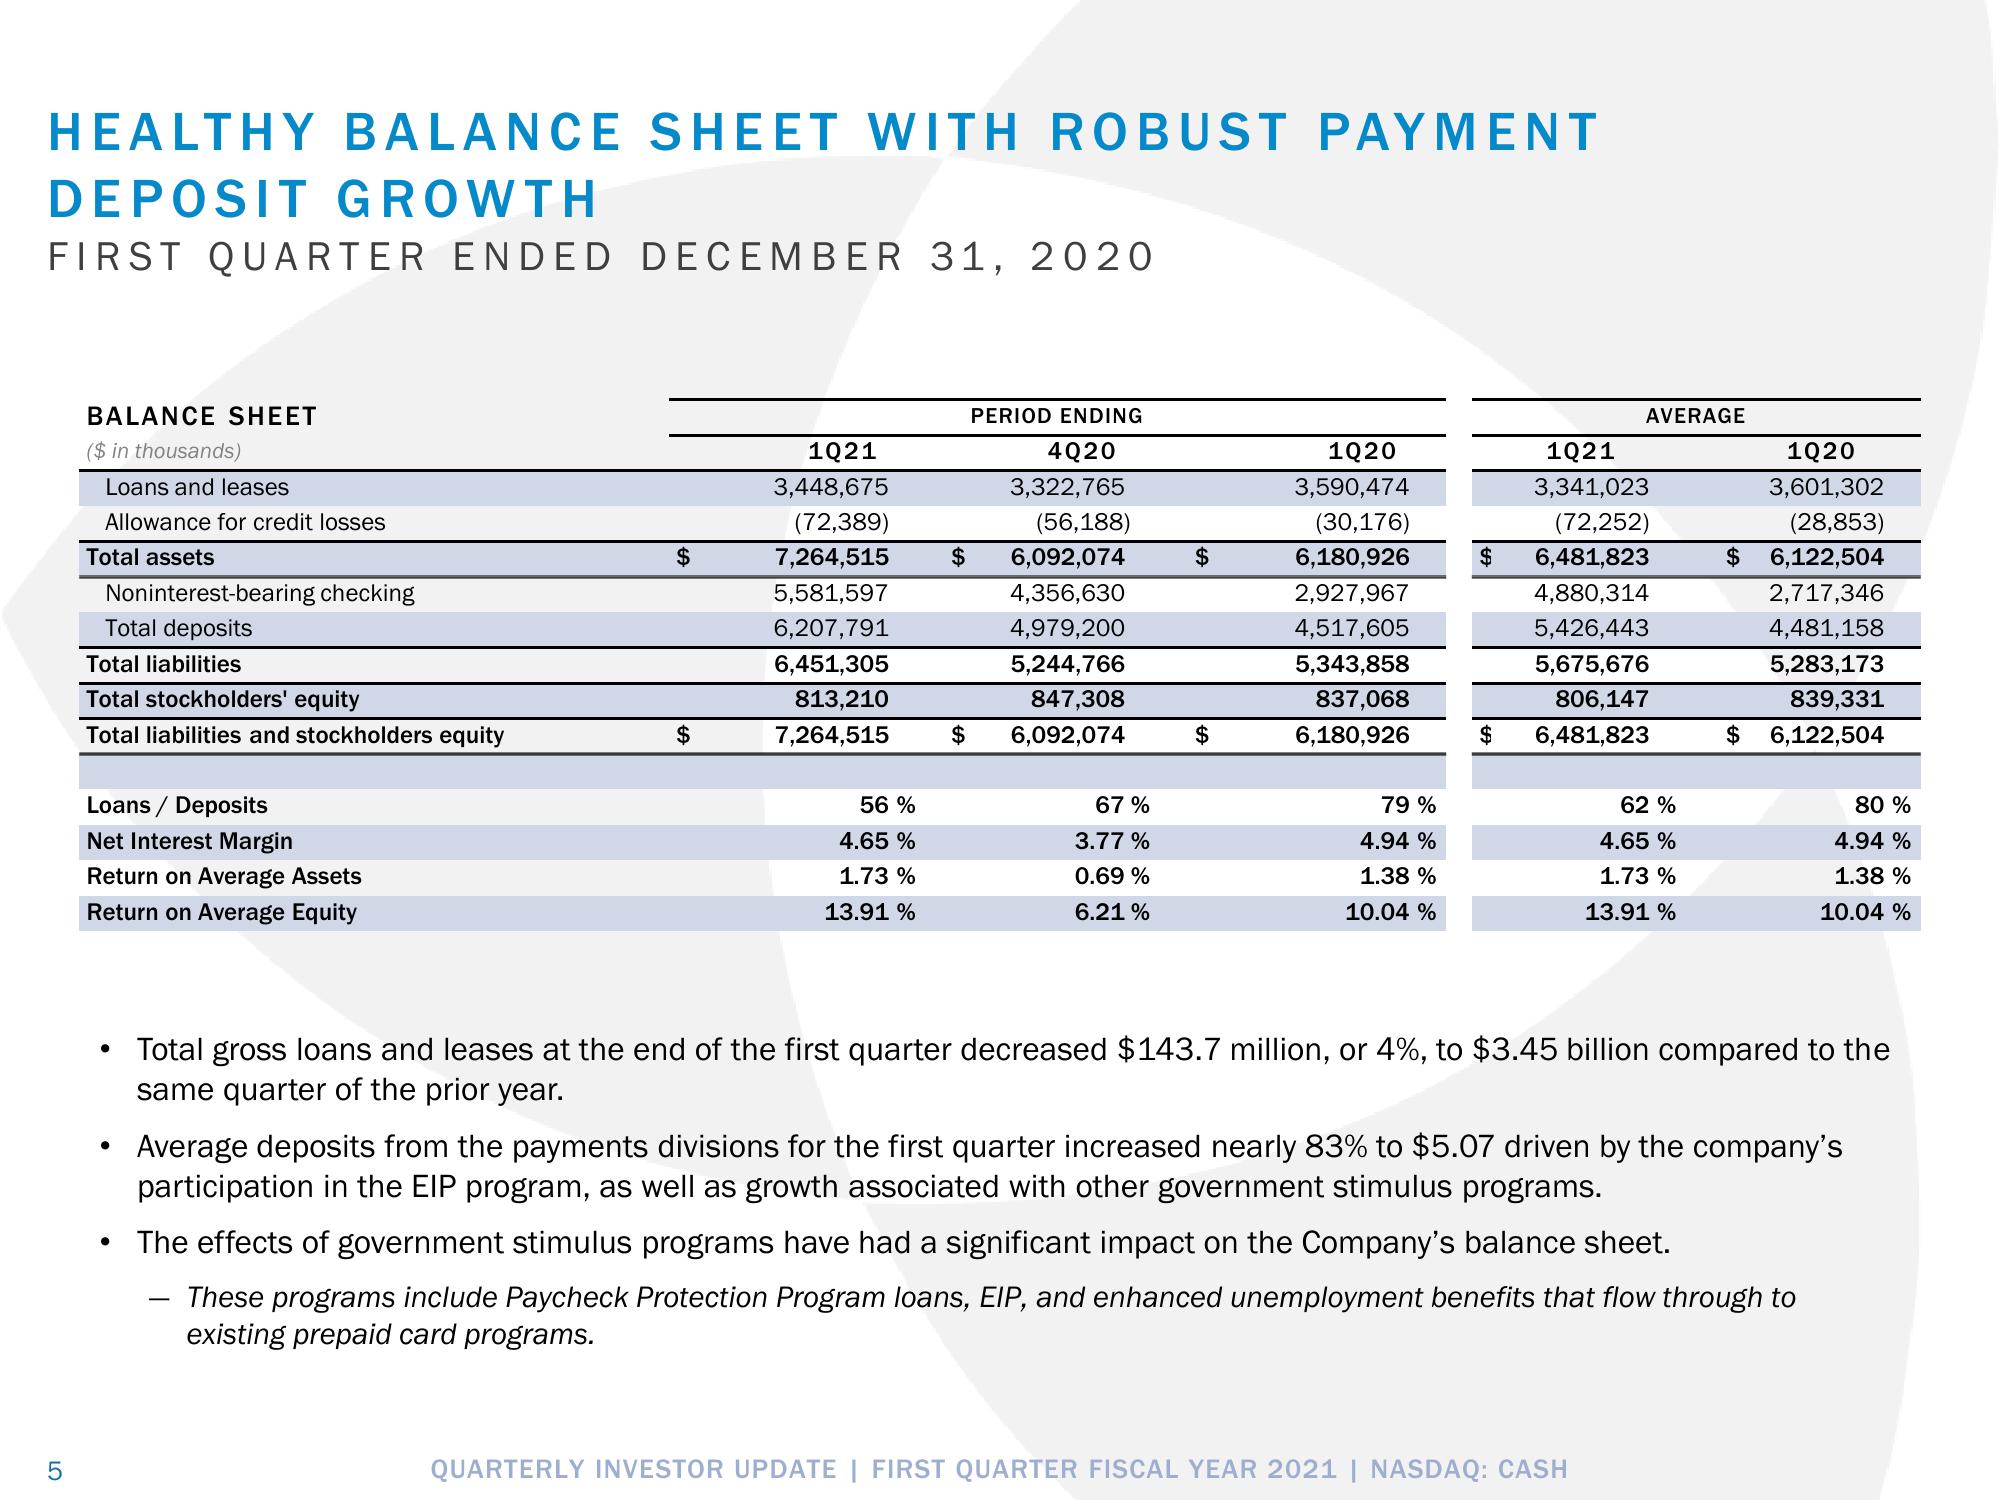
Total gross loans and leases at the end of the first quarter decreased $143.7 million, or 4%, to $3.45 billion compared to the
same quarter of the prior year.
Average deposits from the payments divisions for the first quarter increased nearly 83% to $5.07 driven by the company's
participation in the EIP program, as well as growth associated with other government stimulus programs.
The effects of government stimulus programs have had a significant impact on the Company's balance sheet.
These programs include Paycheck Protection Program loans, EIP, and enhanced unemployment benefits that flow through to
existing prepaid card programs.View entire presentation