AngloAmerican Investor Presentation Deck
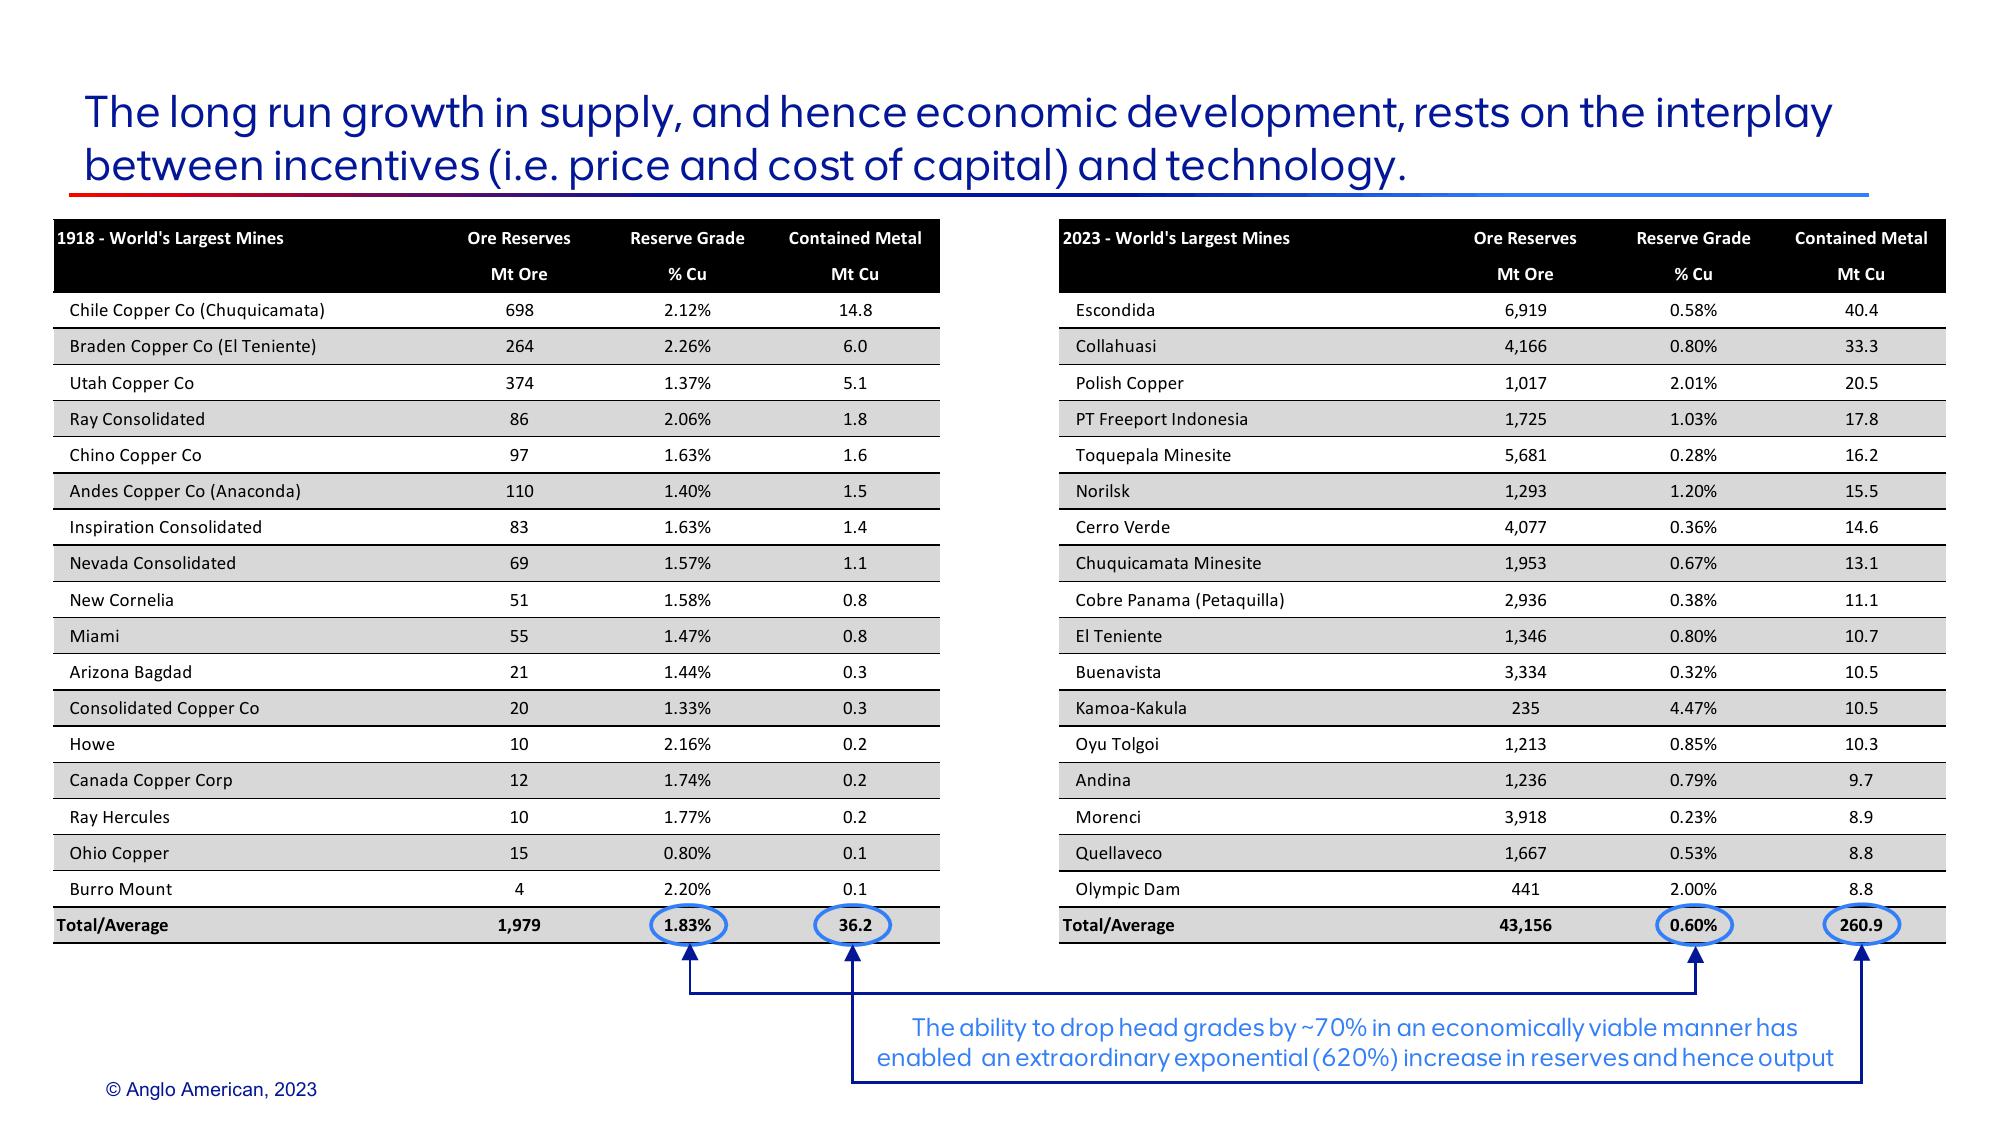
The long run growth in supply, and hence economic development, rests on the interplay
between incentives (i.e. price and cost of capital) and technology.
1918 - World's Largest Mines
Chile Copper Co (Chuquicamata)
Braden Copper Co (El Teniente)
Utah Copper Co
Ray Consolidated
Chino Copper Co
Andes Copper Co (Anaconda)
Inspiration Consolidated
Nevada Consolidated
New Cornelia
Miami
Arizona Bagdad
Consolidated Copper Co
Howe
Canada Copper Corp
Ray Hercules
Ohio Copper
Burro Mount
Total/Average
Anglo American, 2023
Ore Reserves
Mt Ore
698
264
374
86
97
110
83
69
51
55
21
20
10
12
10
15
4
1,979
Reserve Grade
% Cu
2.12%
2.26%
1.37%
2.06%
1.63%
1.40%
1.63%
1.57%
1.58%
1.47%
1.44%
1.33%
2.16%
1.74%
1.77%
0.80%
2.20%
1.83%
Contained Metal
Mt Cu
14.8
6.0
5.1
1.8
1.6
1.5
1.4
1.1
0.8
0.8
0.3
0.3
0.2
0.2
0.2
0.1
0.1
36.2
2023 World's Largest Mines
Escondida
Collahuasi
Polish Copper
PT Freeport Indonesia
Toquepala Minesite
Norilsk
Cerro Verde
Chuquicamata Minesite
Cobre Panama (Petaquilla)
El Teniente
Buenavista
Kamoa-Kakula
Oyu Tolgoi
Andina
Morenci
Quellaveco
Olympic Dam
Total/Average
Ore Reserves
Mt Ore
6,919
4,166
1,017
1,725
5,681
1,293
4,077
1,953
2,936
1,346
3,334
235
1,213
1,236
3,918
1,667
441
43,156
Reserve Grade
% Cu
0.58%
0.80%
2.01%
1.03%
0.28%
1.20%
0.36%
0.67%
0.38%
0.80%
0.32%
4.47%
0.85%
0.79%
0.23%
0.53%
2.00%
0.60%
Contained Metal
The ability to drop head grades by ~70% in an economically viable manner has
enabled an extraordinary exponential (620%) increase in reserves and hence output
Mt Cu
40.4
33.3
20.5
17.8
16.2
15.5
14.6
13.1
11.1
10.7
10.5
10.5
10.3
9.7
8.9
8.8
8.8
260.9View entire presentation