Tradeweb Results Presentation Deck
2Q22 Financial Performance ¹ ($ in thousands, except share and per share amounts) Tradeweb
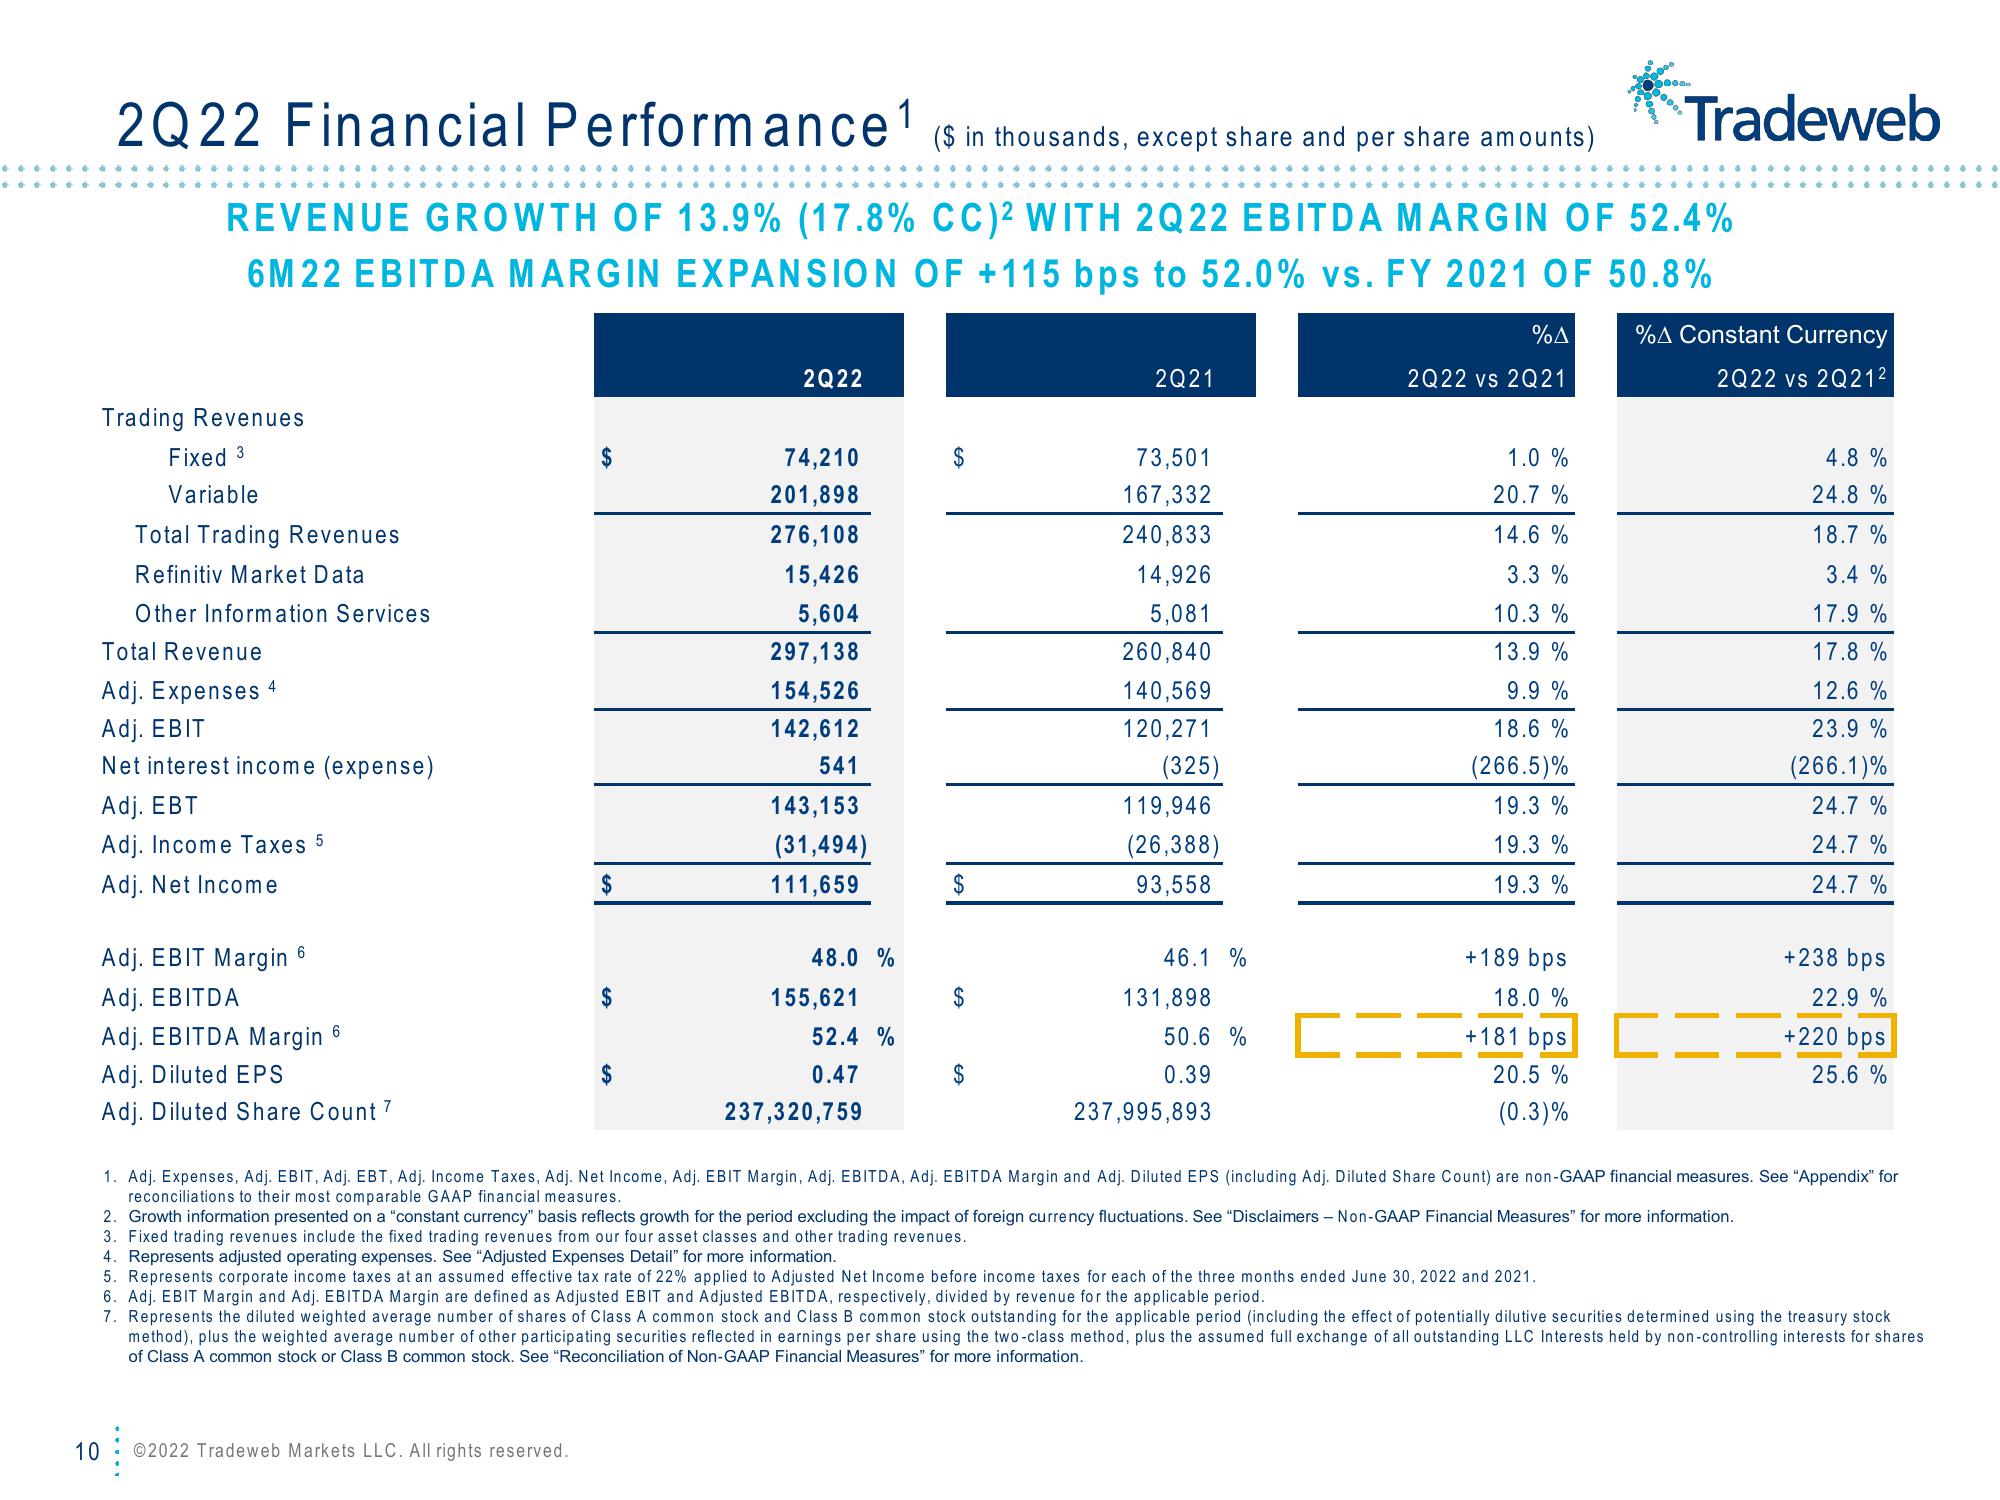
REVENUE GROWTH OF 13.9% (17.8% CC)2 WITH 2Q22 EBITDA MARGIN OF 52.4%
6M 22 EBITDA MARGIN EXPANSION OF +115 bps to 52.0% vs. FY 2021 OF 50.8%
Trading Revenues
Fixed 3
Variable
10
Total Trading Revenues
Refinitiv Market Data
Other Information Services
Total Revenue
Adj. Expenses 4
Adj. EBIT
Net interest income (expense)
Adj. EBT
Adj. Income Taxes 5
Adj. Net Income
Adj. EBIT Margin 6
Adj. EBITDA
Adj. EBITDA Margin 6
Adj. Diluted EPS
Adj. Diluted Share Count 7
$
$
$
$
©2022 Tradeweb Markets LLC. All rights reserved.
2Q22
74,210
201,898
276,108
15,426
5,604
297,138
154,526
142,612
541
143,153
(31,494)
111,659
48.0 %
155,621
52.4 %
0.47
237,320,759
$
$
$
2Q21
73,501
167,332
240,833
14,926
5,081
260,840
140,569
120,271
(325)
119,946
(26,388)
93,558
46.1 %
131,898
50.6 %
0.39
237,995,893
%A
2Q22 vs 2Q21
1.0 %
20.7 %
14.6%
3.3 %
10.3 %
13.9%
9.9 %
18.6%
(266.5)%
19.3%
19.3 %
19.3%
+189 bps
18.0 %
+181 bps
20.5%
(0.3)%
000.
4. Represents adjusted operating expenses. See "Adjusted Expenses Detail" for more information.
5. Represents corporate income taxes at an assumed effective tax rate of 22% applied to Adjusted Net Income before income taxes for each of the three months ended June 30, 2022 and 2021.
0000
%A Constant Currency
2Q22 vs 2Q21²
2. Growth information presented on a "constant currency" basis reflects growth for the period excluding the impact of foreign currency fluctuations. See "Disclaimers - Non-GAAP Financial Measures" for more information.
3. Fixed trading revenues include the fixed trading revenues from our four asset classes and other trading revenues.
4.8 %
24.8%
18.7%
3.4 %
17.9 %
17.8 %
12.6 %
23.9 %
(266.1)%
24.7%
24.7%
24.7%
1. Adj. Expenses, Adj. EBIT, Adj. EBT, Adj. Income Taxes, Adj. Net Income, Adj. EBIT Margin, Adj. EBITDA, Adj. EBITDA Margin and Adj. Diluted EPS (including Adj. Diluted Share Count) are non-GAAP financial measures. See "Appendix" for
reconciliations to their most comparable GAAP financial measures.
+238 bps
22.9%
+220 bps
25.6 %
6. Adj. EBIT Margin and Adj. EBITDA Margin are defined as Adjusted EBIT and Adjusted EBITDA, respectively, divided by revenue for the applicable period.
7. Represents the diluted weighted average number of shares of Class A common stock and Class B common stock outstanding for the applicable period (including the effect of potentially dilutive securities determined using the treasury stock
method), plus the weighted average number of other participating securities reflected in earnings per share using the two-class method, plus the assumed full exchange of all outstanding LLC Interests held by non-controlling interests for shares
of Class A common stock or Class B common stock. See "Reconciliation of Non-GAAP Financial Measures" for more information.View entire presentation