Pathward Financial Results Presentation Deck
Non-GAAP Reconciliation
24
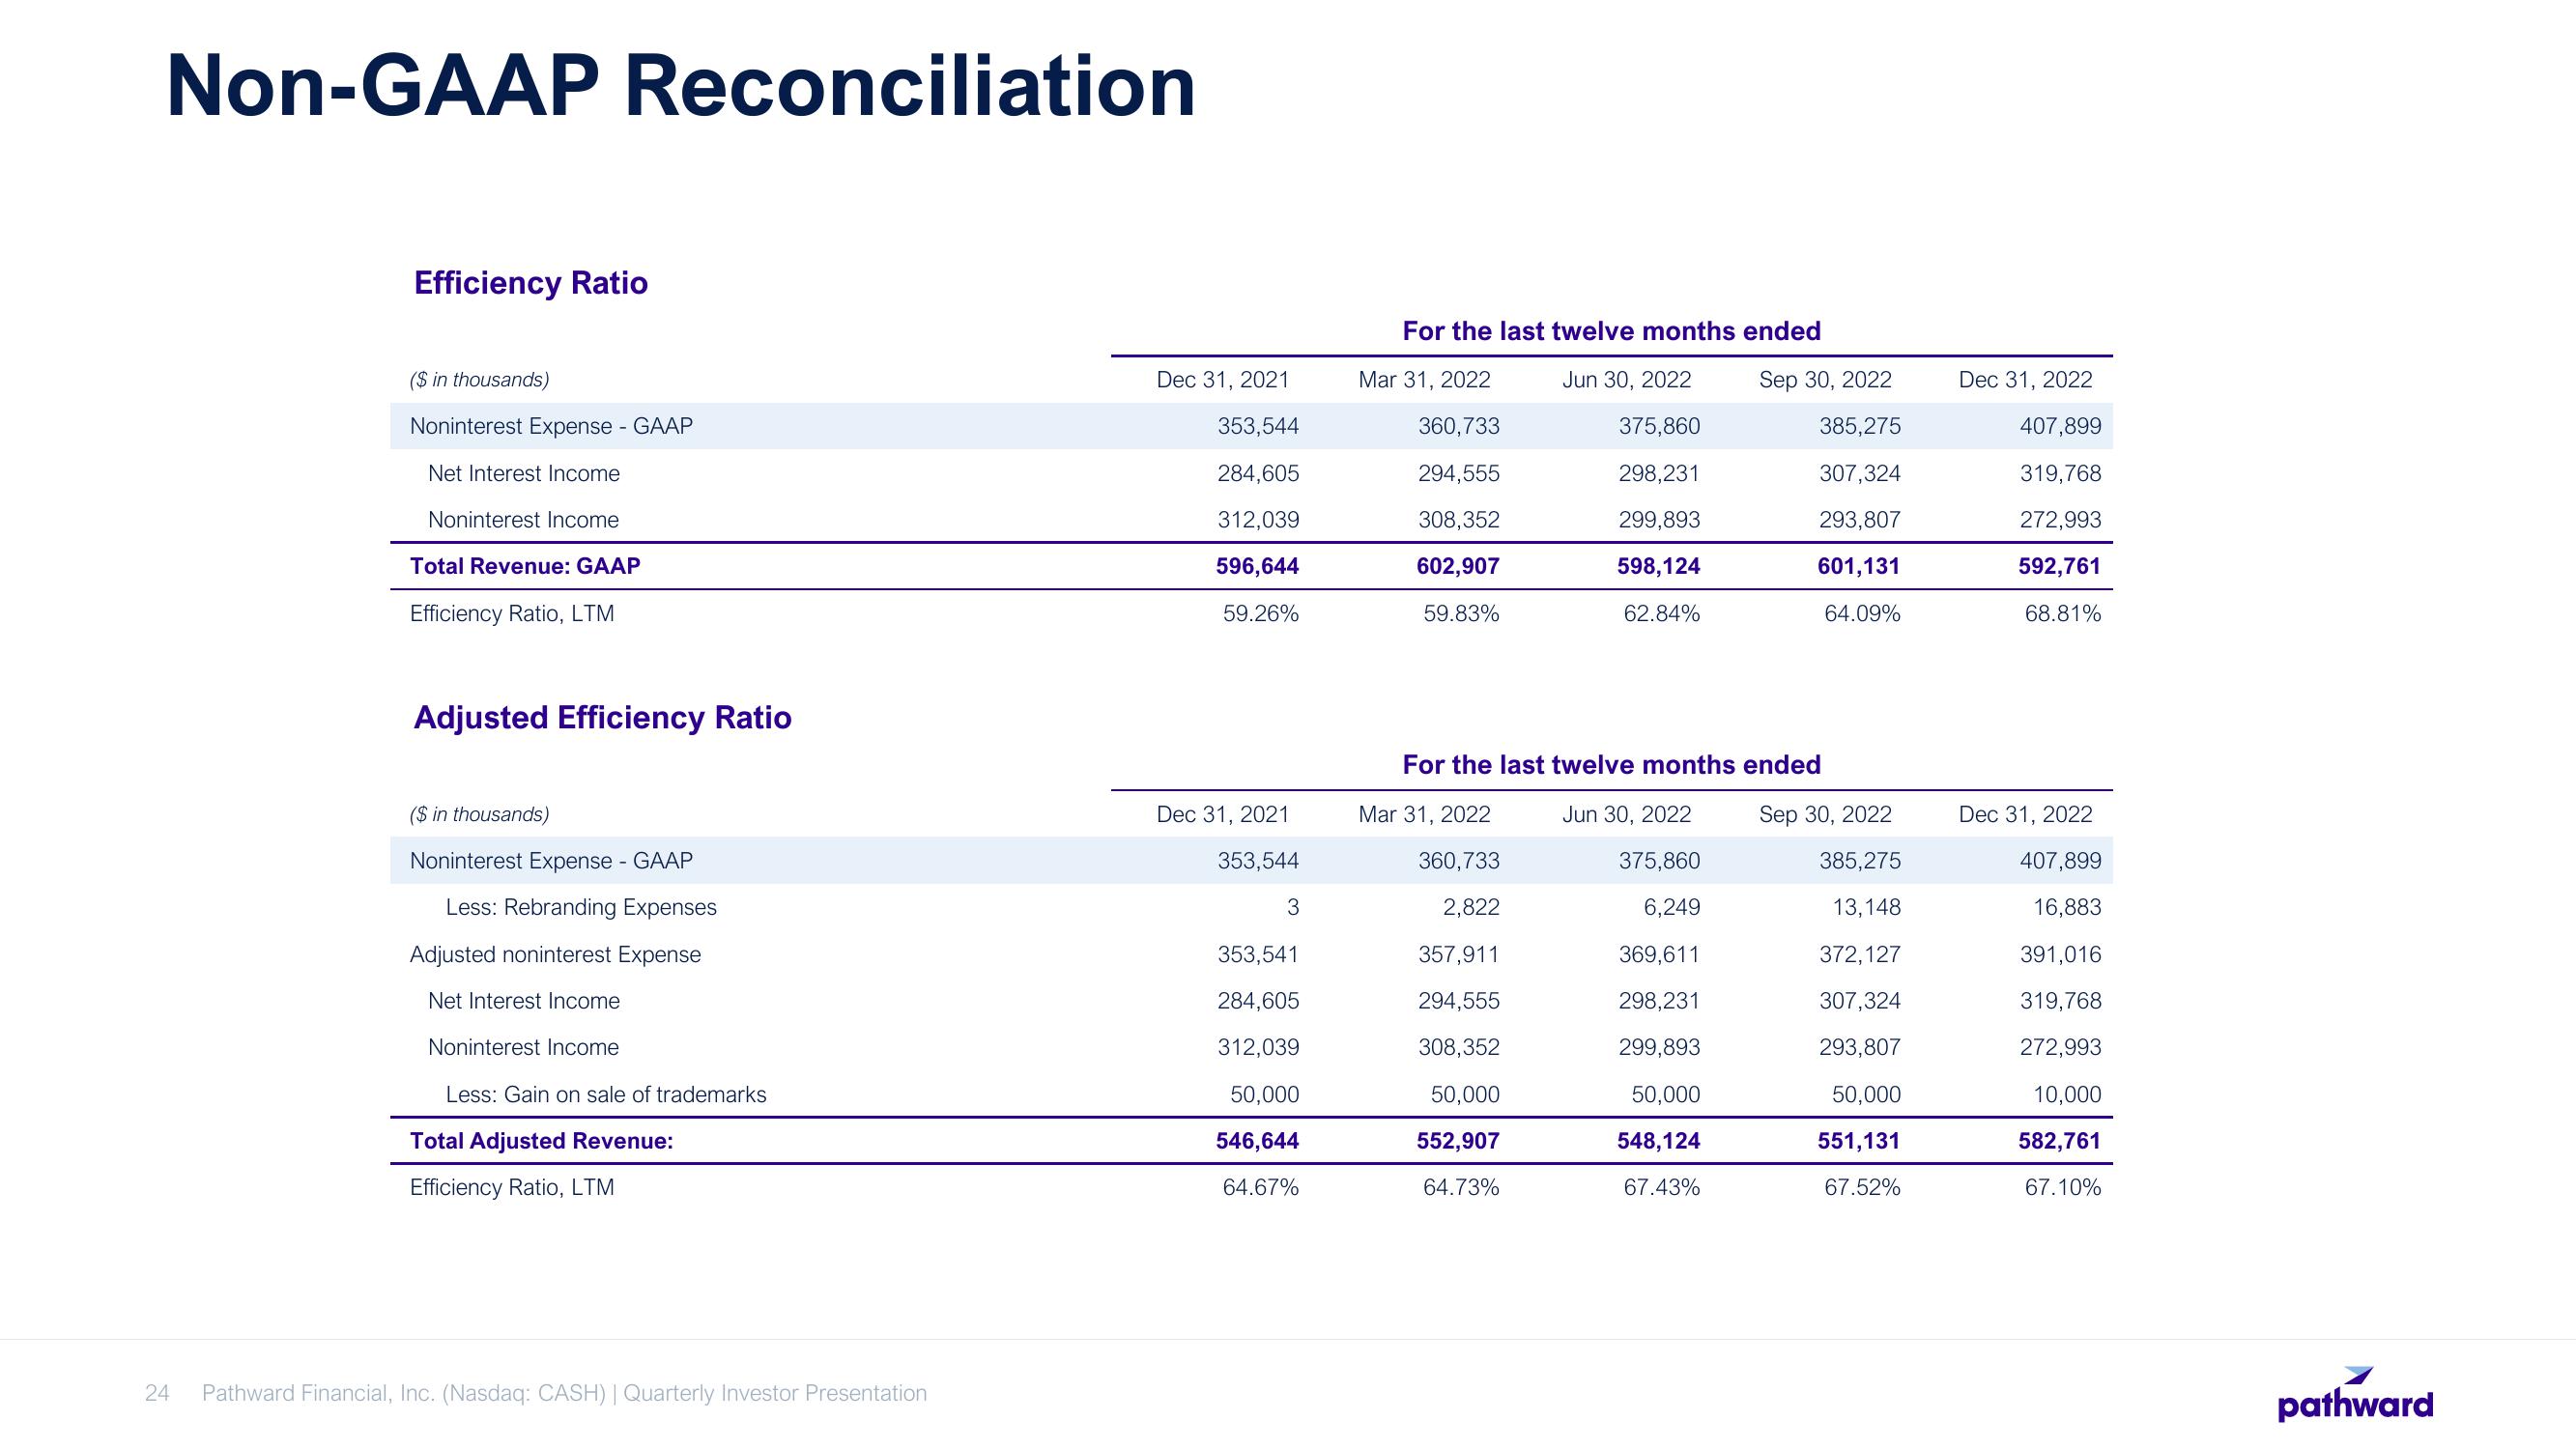
Efficiency Ratio
($ in thousands)
Noninterest Expense - GAAP
Net Interest Income
Noninterest Income
Total Revenue: GAAP
Efficiency Ratio, LTM
Adjusted Efficiency Ratio
($ in thousands)
Noninterest Expense - GAAP
Less: Rebranding Expenses
Adjusted noninterest Expense
Net Interest Income
Noninterest Income
Less: Gain on sale of trademarks
Total Adjusted Revenue:
Efficiency Ratio, LTM
Pathward Financial, Inc. (Nasdaq: CASH) | Quarterly Investor Presentation
Dec 31, 2021
353,544
284,605
312,039
596,644
59.26%
Dec 31, 2021
353,544
3
353,541
284,605
312,039
50,000
546,644
64.67%
For the last twelve months ended
Jun 30, 2022
375,860
298,231
299,893
598,124
62.84%
Mar 31, 2022
360,733
294,555
308,352
602,907
59.83%
Sep 30, 2022
385,275
307,324
293,807
601,131
64.09%
For the last twelve months ended
Jun 30, 2022
375,860
6,249
369,611
298,231
299,893
50,000
548,124
67.43%
Mar 31, 2022
360,733
2,822
357,911
294,555
308,352
50,000
552,907
64.73%
Sep 30, 2022
385,275
13,148
372,127
307,324
293,807
50,000
551,131
67.52%
Dec 31, 2022
407,899
319,768
272,993
592,761
68.81%
Dec 31, 2022
407,899
16,883
391,016
319,768
272,993
10,000
582,761
67.10%
pathwardView entire presentation