ads-tec Energy SPAC Presentation Deck
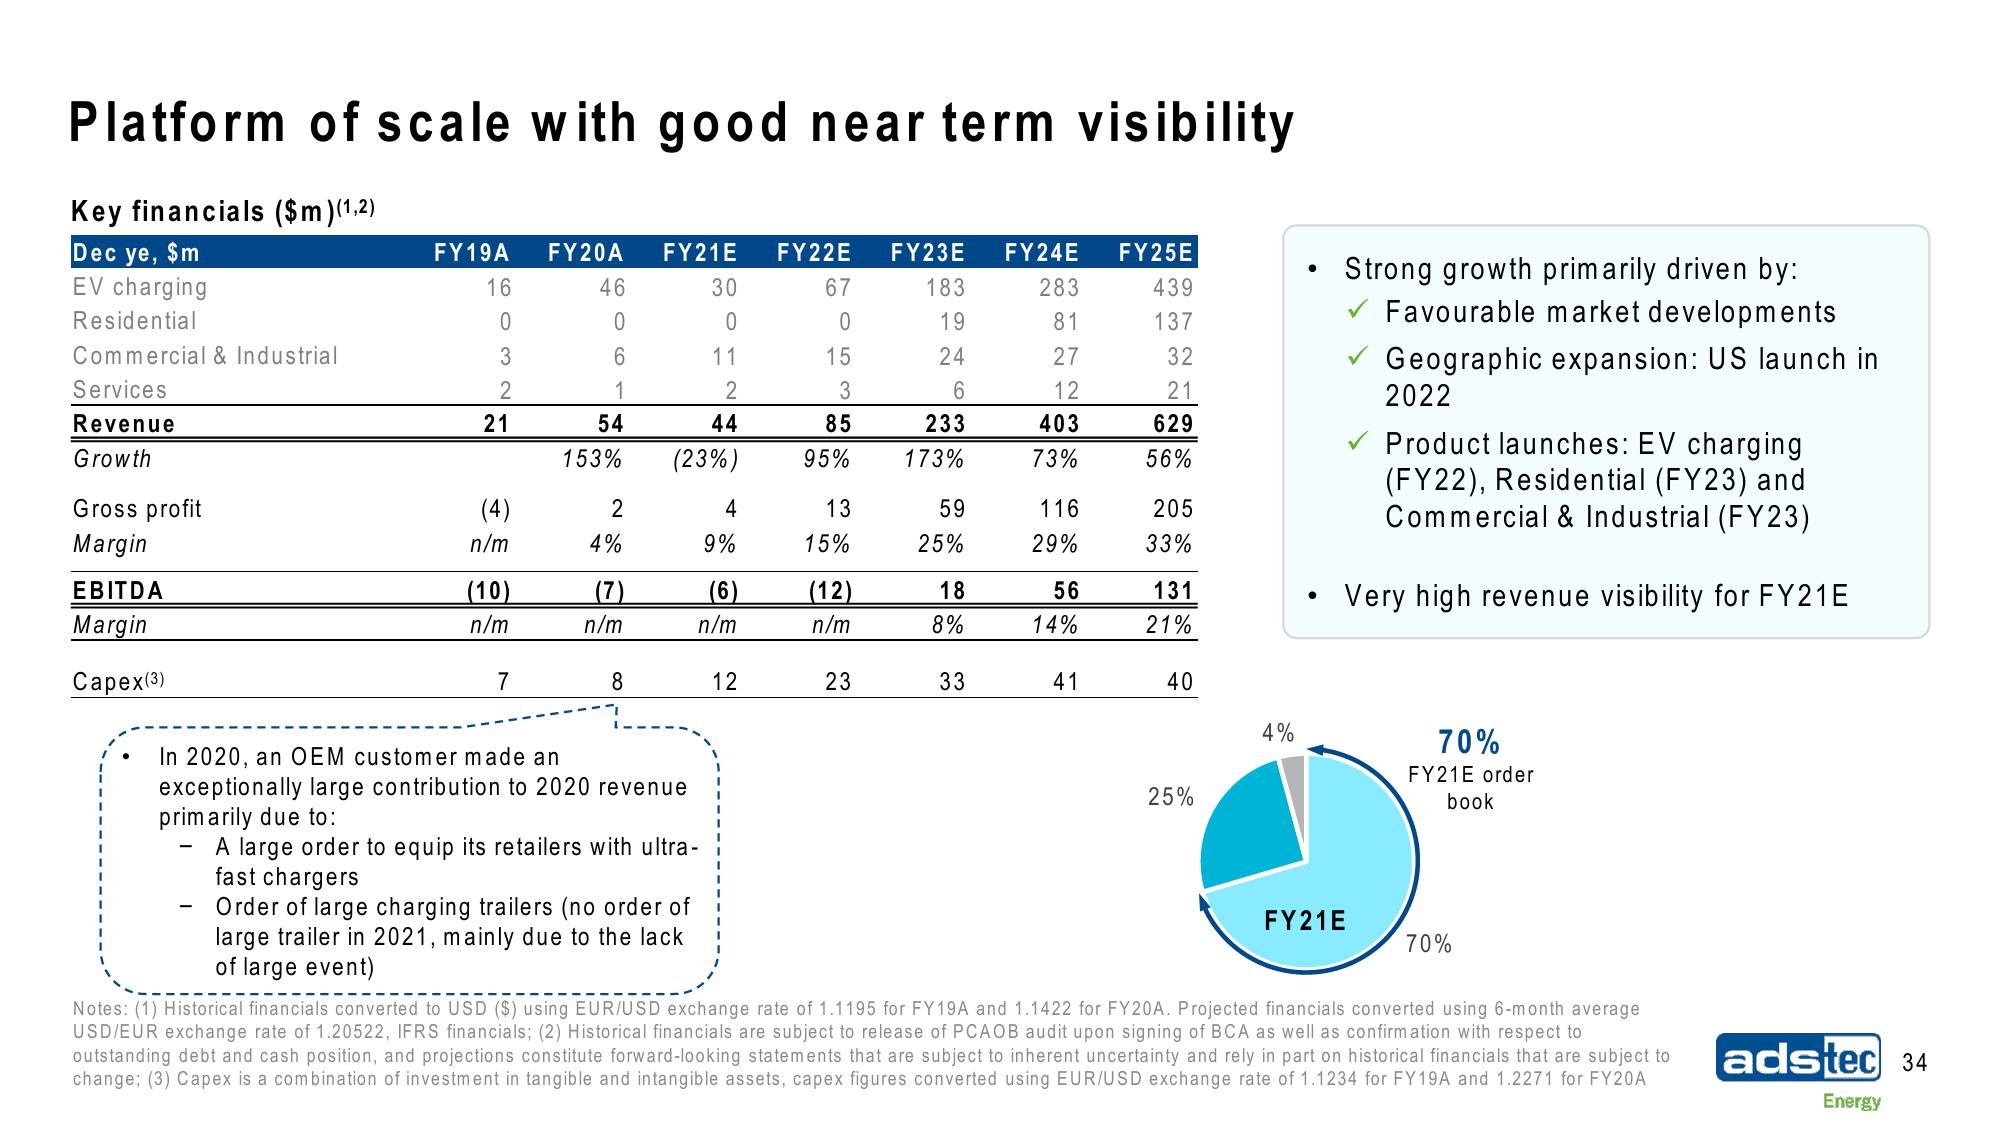
Platform of scale with good near term visibility
Key financials ($m)(1,2)
Dec ye, $m
EV charging
Residential
Commercial & Industrial
Services
Revenue
Growth
Gross profit
Margin
EBITDA
Margin
Capex(3)
FY19A
16
0
3
2
-
21
(4)
n/m
(10)
n/m
7
FY20A
46
0
6
1
54
153%
2
4%
(7)
n/m
8
FY21E FY22E FY23E FY24E FY25E
439
183
283
19
81
137
24
27
32
12
21
6
233
173%
403
629
73%
56%
11
2
44
(23%)
In 2020, an OEM customer made an
exceptionally large contribution to 2020 revenue
primarily due to:
A large order to equip its retailers with ultra-
fast chargers
30
0
Order of large charging trailers (no order of
large trailer in 2021, mainly due to the lack
of large event)
4
9%
(6)
n/m
12
67
0
15
3
85
95%
13
15%
(12)
n/m
23
59
25%
18
8%
33
116
29%
56
14%
41
205
33%
131
21%
40
25%
4%
●
Strong growth primarily driven by:
Favourable market developments
Geographic expansion: US launch in
2022
Product launches: EV charging
(FY22), Residential (FY23) and
Commercial & Industrial (FY23)
Very high revenue visibility for FY21E
FY21E
70%
FY21E order
book
70%
Notes: (1) Historical financials converted to USD ($) using EUR/USD exchange rate of 1.1195 for FY19A and 1.1422 for FY20A. Projected financials converted using 6-month average
USD/EUR exchange rate of 1.20522, IFRS financials; (2) Historical financials are subject to release of PCAOB audit upon signing of BCA as well as confirmation with respect to
outstanding debt and cash position, and projections constitute forward-looking statements that are subject to inherent uncertainty and rely in part on historical financials that are subject to
change; (3) Capex is a combination of investment in tangible and intangible assets, capex figures converted using EUR/USD exchange rate of 1.1234 for FY19A and 1.2271 for FY20A
adstec 34
EnergyView entire presentation