Origin SPAC Presentation Deck
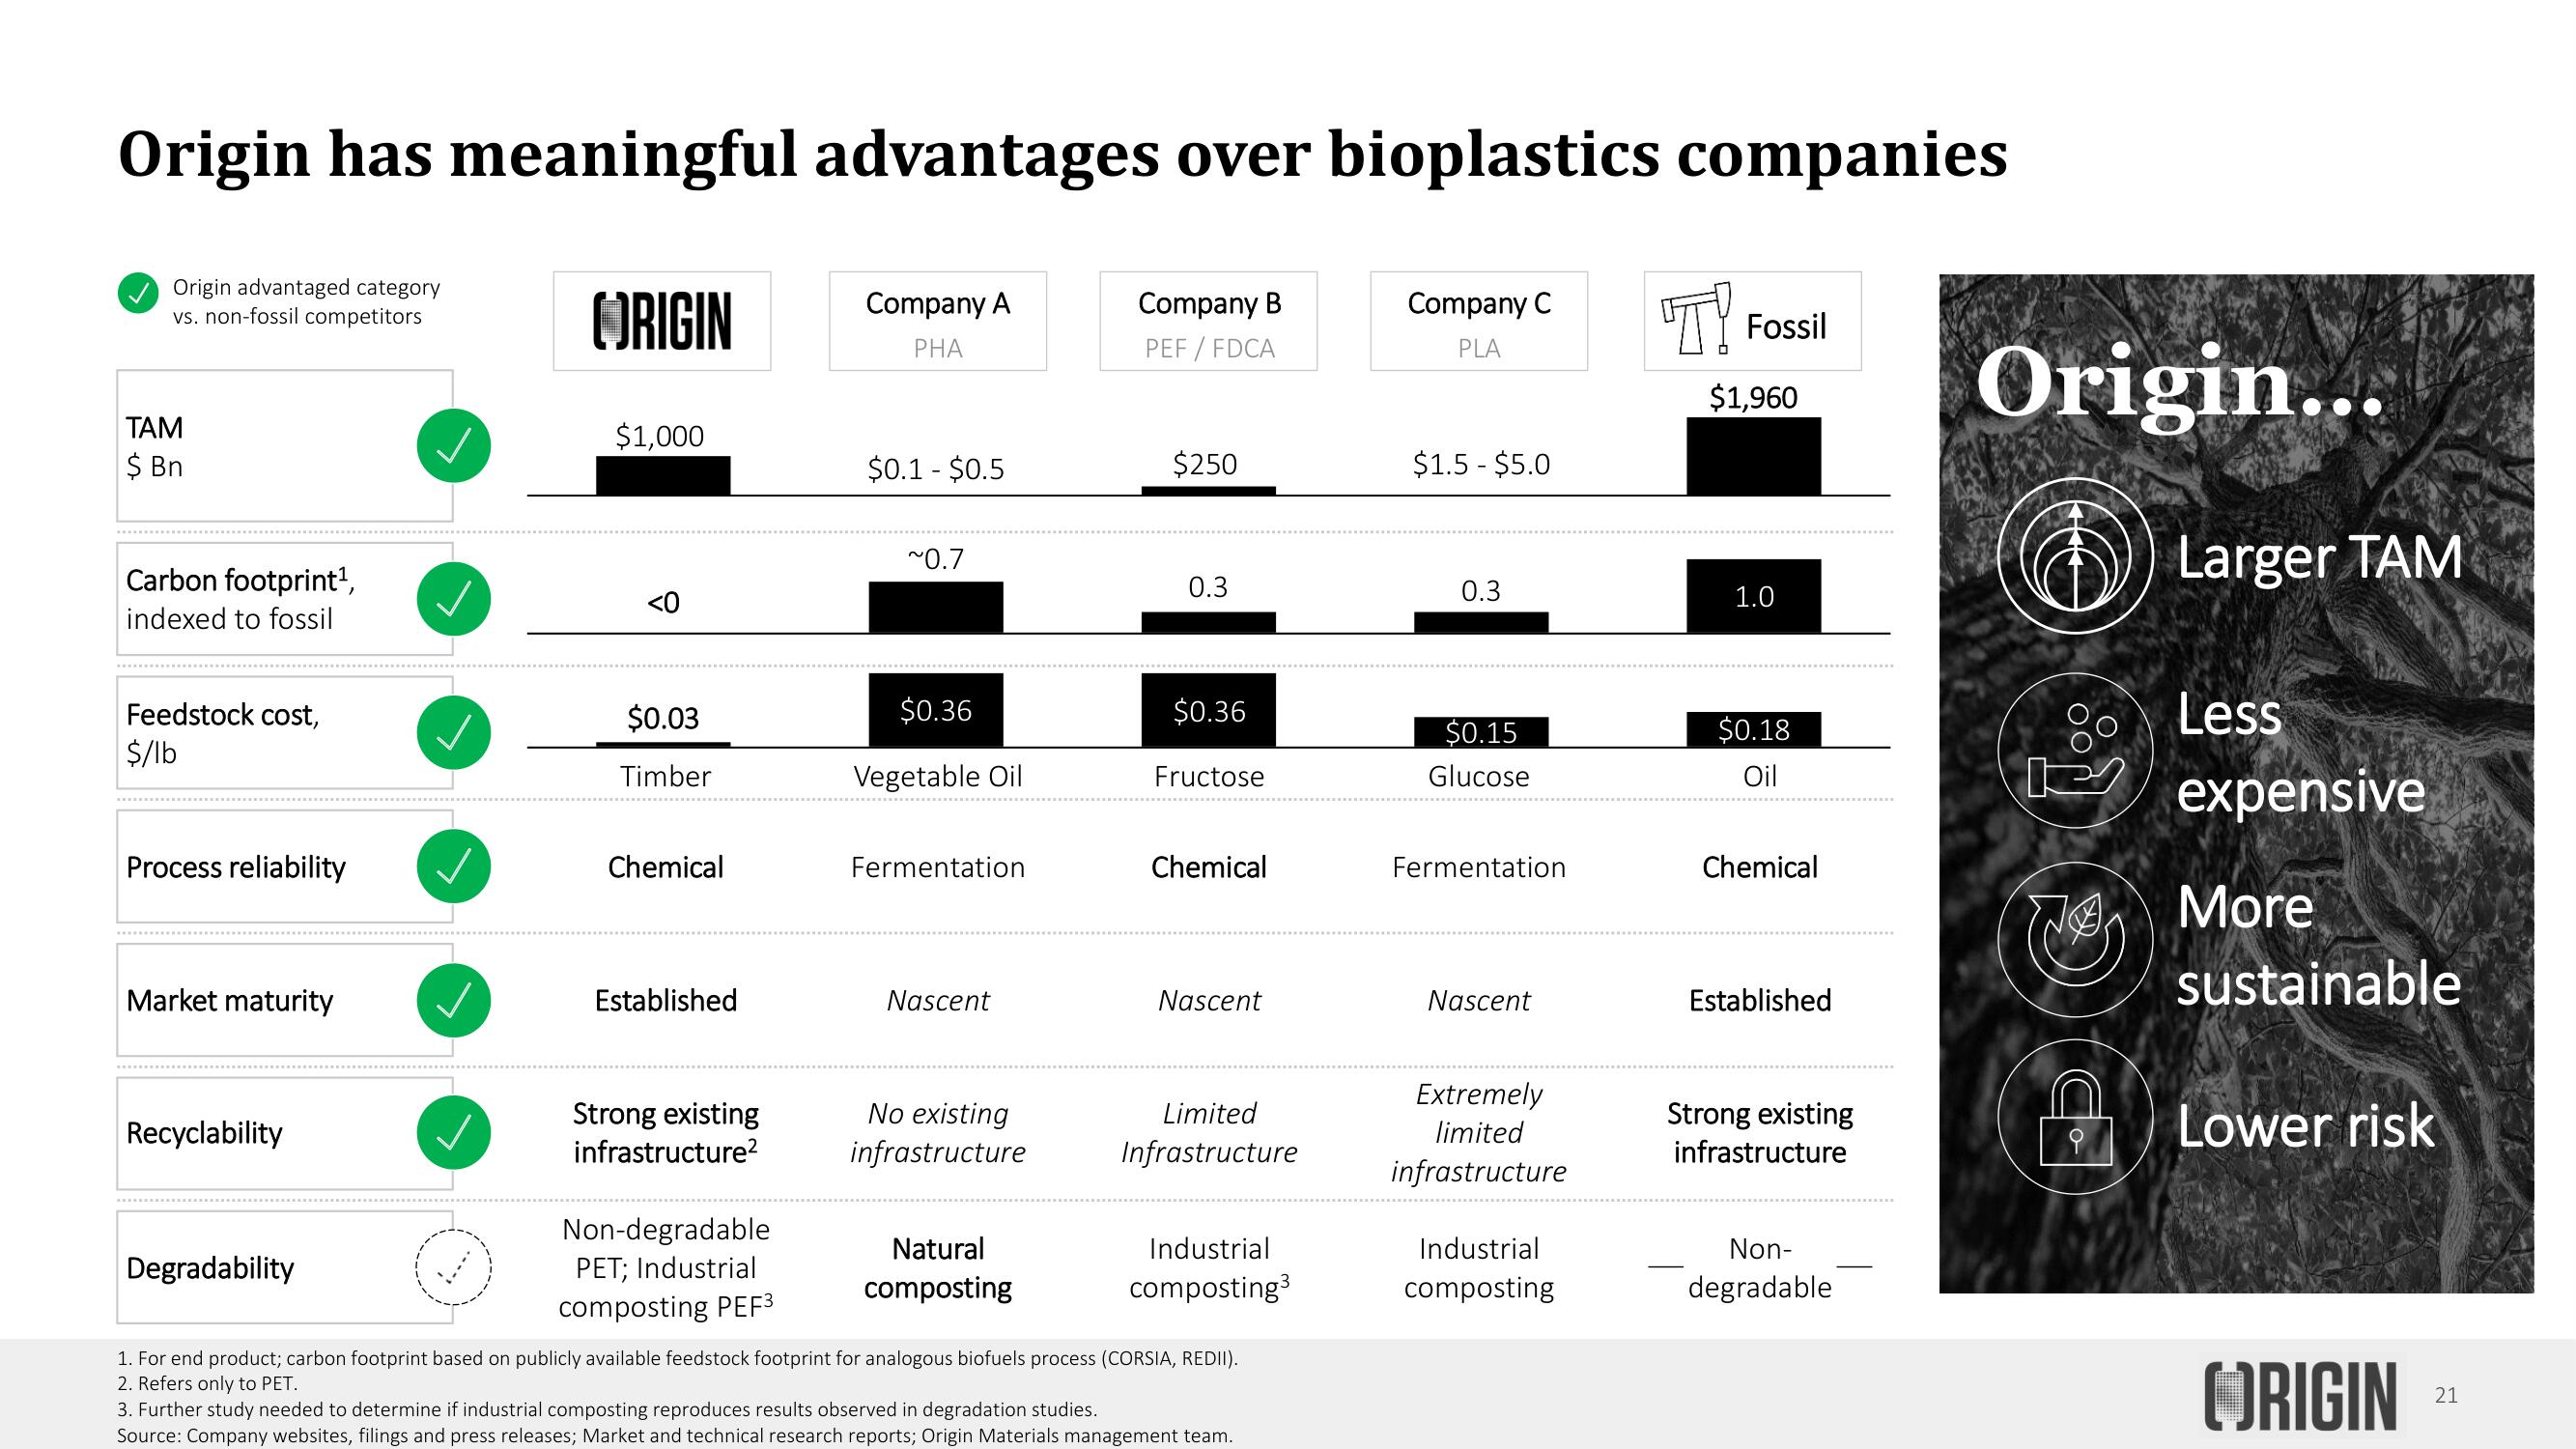
Origin has meaningful advantages over bioplastics companies
Origin advantaged category
vs. non-fossil competitors
TAM
$ Bn
Carbon footprint¹,
indexed to fossil
Feedstock cost,
$/lb
Process reliability
Market maturity
Recyclability
Degradability
ORIGIN
$1,000
<0
$0.03
Timber
Chemical
Established
Strong existing
infrastructure²
Non-degradable
PET; Industrial
composting PEF³
Company A
PHA
$0.1 - $0.5
~0.7
$0.36
Vegetable Oil
Fermentation
Nascent
No existing
infrastructure
Natural
composting
Company B
PEF / FDCA
$250
0.3
$0.36
Fructose
Chemical
Nascent
Limited
Infrastructure
Industrial
composting³
1. For end product; carbon footprint based on publicly available feedstock footprint for analogous biofuels process (CORSIA, REDII).
2. Refers only to PET.
3. Further study needed to determine if industrial composting reproduces results observed in degradation studies.
Source: Company websites, filings and press releases; Market and technical research reports; Origin Materials management team.
Company C
PLA
$1.5- $5.0
0.3
$0.15
Glucose
Fermentation
Nascent
Extremely
limited
infrastructure
Industrial
composting
'T!
Fossil
$1,960
1.0
$0.18
Oil
Chemical
Established
Strong existing
infrastructure
Non-
degradable
Origin...
JA
Larger TAM
Less
expensive
More
sustainable
Lower risk
ORIGIN
21View entire presentation