Tudor, Pickering, Holt & Co Investment Banking
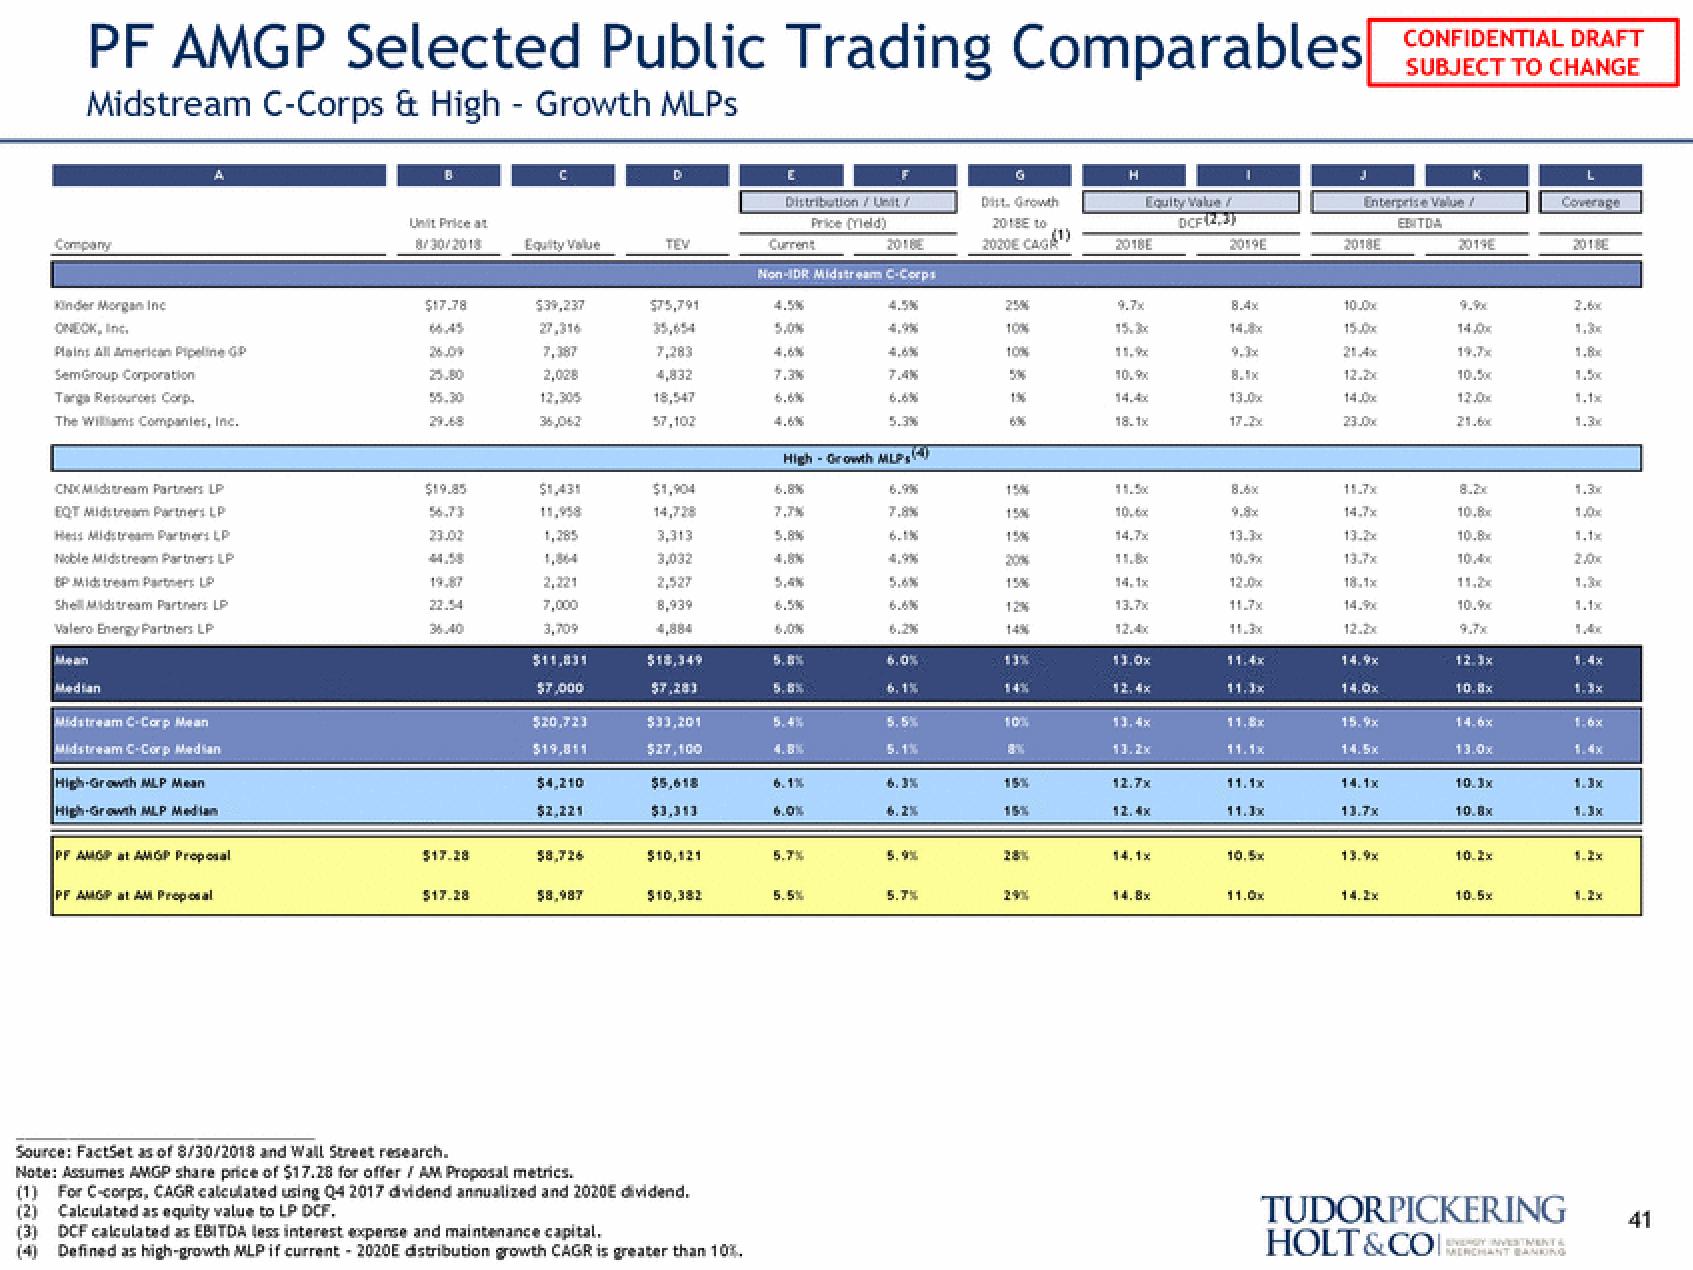
PF AMGP Selected Public Trading Comparables
Midstream C-Corps & High - Growth MLPs
Company
Kinder Morgan Inc
ONEOK, Inc.
Plains All American Pipeline GP
SemGroup Corporation
Tanga Resources Corp.
The Williams Companies, Inc.
A
CNX Midstream Partners LP
EQT Midstream Partners LP
He Midstream Partners LP
Noble Midstream Partners LP
BP Midstream Partners LP
Shell Midstream Partners LP
Valero Energy Partners LP
Median
Midstream C-Corp Mean
Midstream C-Corp Median
High-Growth MLP Mean
High-Growth MLP Median
PF AMGP at AMGP Proposal
PF AMGP at AM Proposal
Unit Price at
8/30/2018
$17.78
26.09
22.54
36.40
$17.28
$17.28
Equity Value
$39,237
2,028
36,062
$1,431
2,221
7,000
3,709
$11,831
$7,000
$20,723
$4,210
$2,221
$8,726
$8,987
D
TEV
7,283
$1,904
3,313
3,032
2,527
8,939
4,884
$18,349
$7.283
$33,201
$27,100
$5,618
$3,313
$10,121
$10,382
Source: FactSet as of 8/30/2018 and Wall Street research.
Note: Assumes AMGP share price of $17.28 for offer / AM Proposal metrics.
(1) For C-corps, CAGR calculated using Q4 2017 dividend annualized and 2020E dividend.
(2) Calculated as equity value to LP DCF.
(3)
DCF calculated as EBITDA less interest expense and maintenance capital.
Defined as high-growth MLP if current - 2020E distribution growth CAGR is greater than 10%.
Distribution/Unit /
Price [field)
Current
Non-IDR Midstream C-Corps
7.3%
High-Growth MLPs (4)
5.8%
5.8%
5.8%
6.1%
5.7%
5.5%
6.0%
6.1%
5.5%
5.1%
5.7%
2018 to
2020E CAGR
25%
10%
10%
5%
196
15%
15%
20%
15%
12%
13%
10%
28%
29%
H
Equity Value /
DCF(2,3)
2018E
10.9x
18.1x
13.7x
12.4x
13.0x
13.2x
12.7x
12.4x
14.1x
2019E
8.4x
13.0x
13.3x
11.7x
11.3x
11.4x
11.3x
11.1x
11.1x
11.3x
td.Ex
11.0x
Enterprise Value
EBITDA
2018E
10.0x
15.0x
12.20
14.0x
23.0x
11.7x
12.2x
14.9x
14.0x
15.9x
1.5x
14.1x
13.7x
13.9x
CONFIDENTIAL DRAFT
SUBJECT TO CHANGE
14.2x
K
2019E
14.0x
10.0
12.0x
21.6x
10.8x
10,4x
10.9x
12.3x
10.8x
14.6x
13.0x
10.3x
10.8x
10.2x
fu Ex
TUDORPICKERING
HOLT&CO CHANT BANKING
2018E
1.1x
1.3
1.3x
1,0x
20x
1.3x
1.3x
1.2x
41View entire presentation