Bird SPAC Presentation Deck
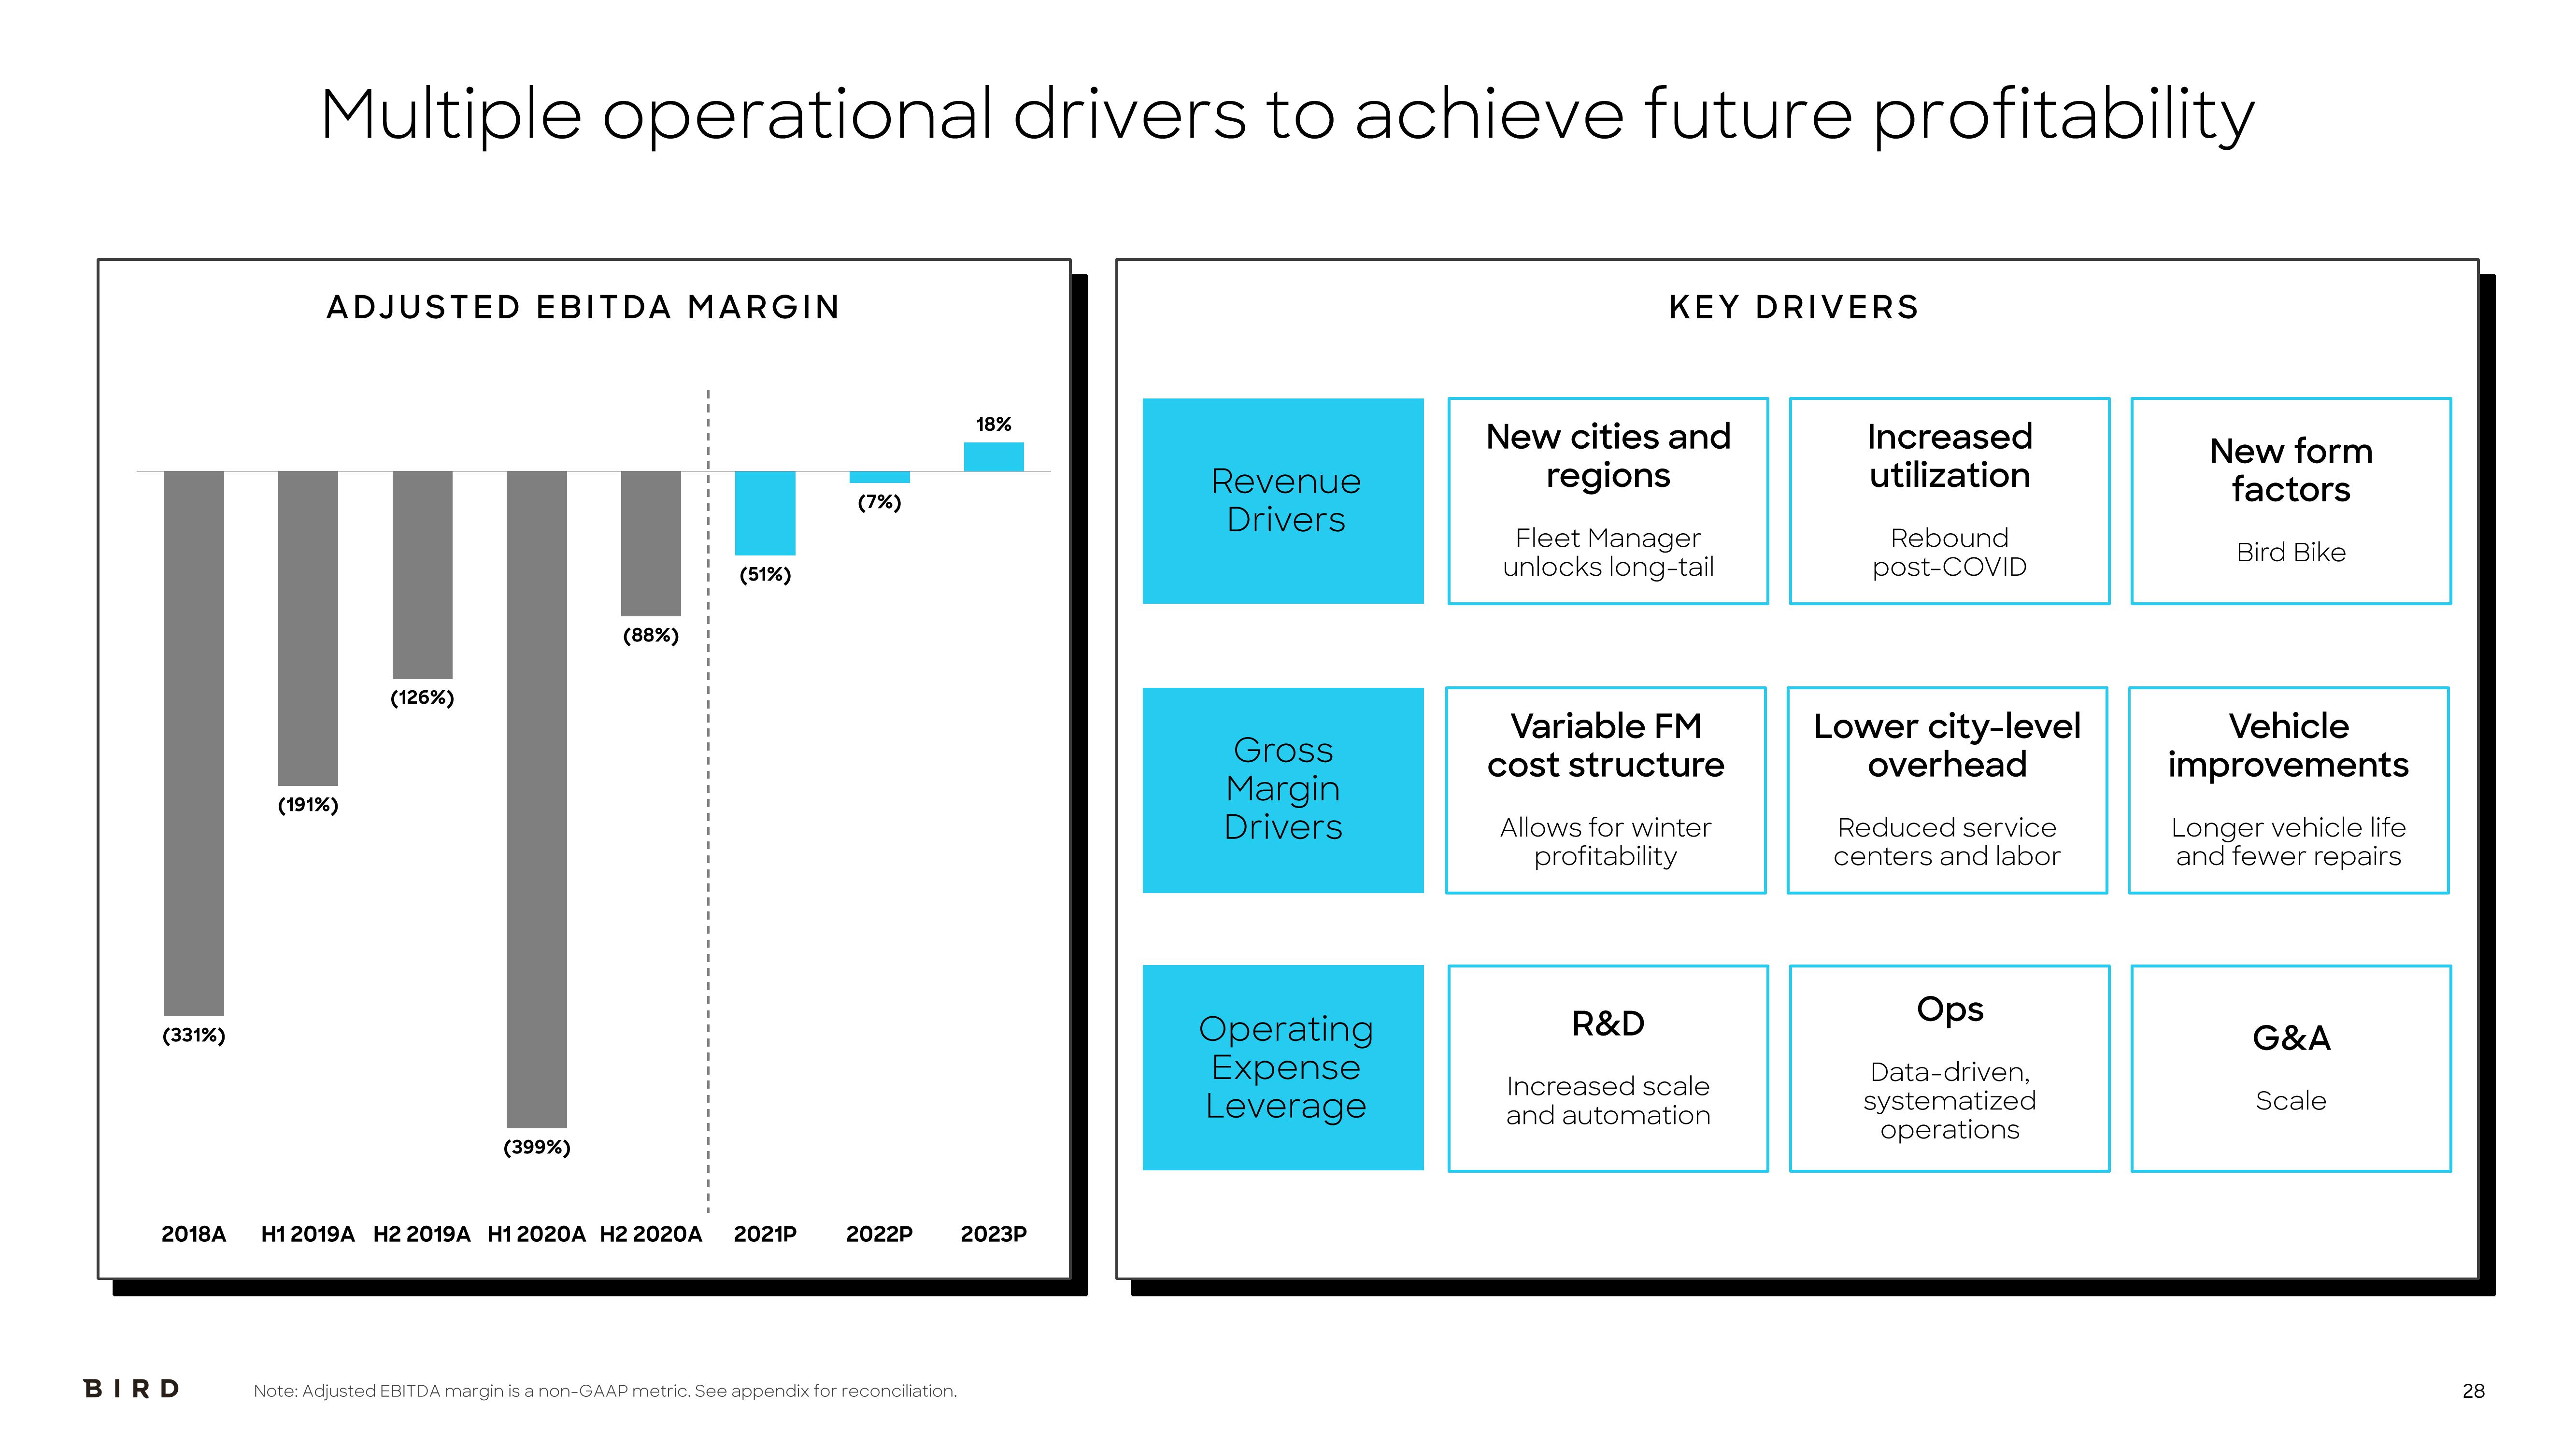
(331%)
(88%)
(126%)
||
(191%)
2018A
Multiple operational drivers to achieve future profitability
BIRD
ADJUSTED EBITDA MARGIN
(399%)
(51%)
(7%)
H1 2019A H2 2019A H1 2020A H2 2020A 2021P 2022P
Note: Adjusted EBITDA margin is a non-GAAP metric. See appendix for reconciliation.
18%
2023P
Revenue
Drivers
Gross
Margin
Drivers
Operating
Expense
Leverage
KEY DRIVERS
New cities and
regions
Fleet Manager
unlocks long-tail
Variable FM
cost structure
Allows for winter
profitability
R&D
Increased scale
and automation
Increased
utilization
Rebound
post-COVID
Lower city-level
overhead
Reduced service
centers and labor
Ops
Data-driven,
systematized
operations
New form
factors
Bird Bike
Vehicle
improvements
Longer vehicle life
and fewer repairs
G&A
Scale
28View entire presentation