WeWork Results Presentation Deck
Q2 Financial Results
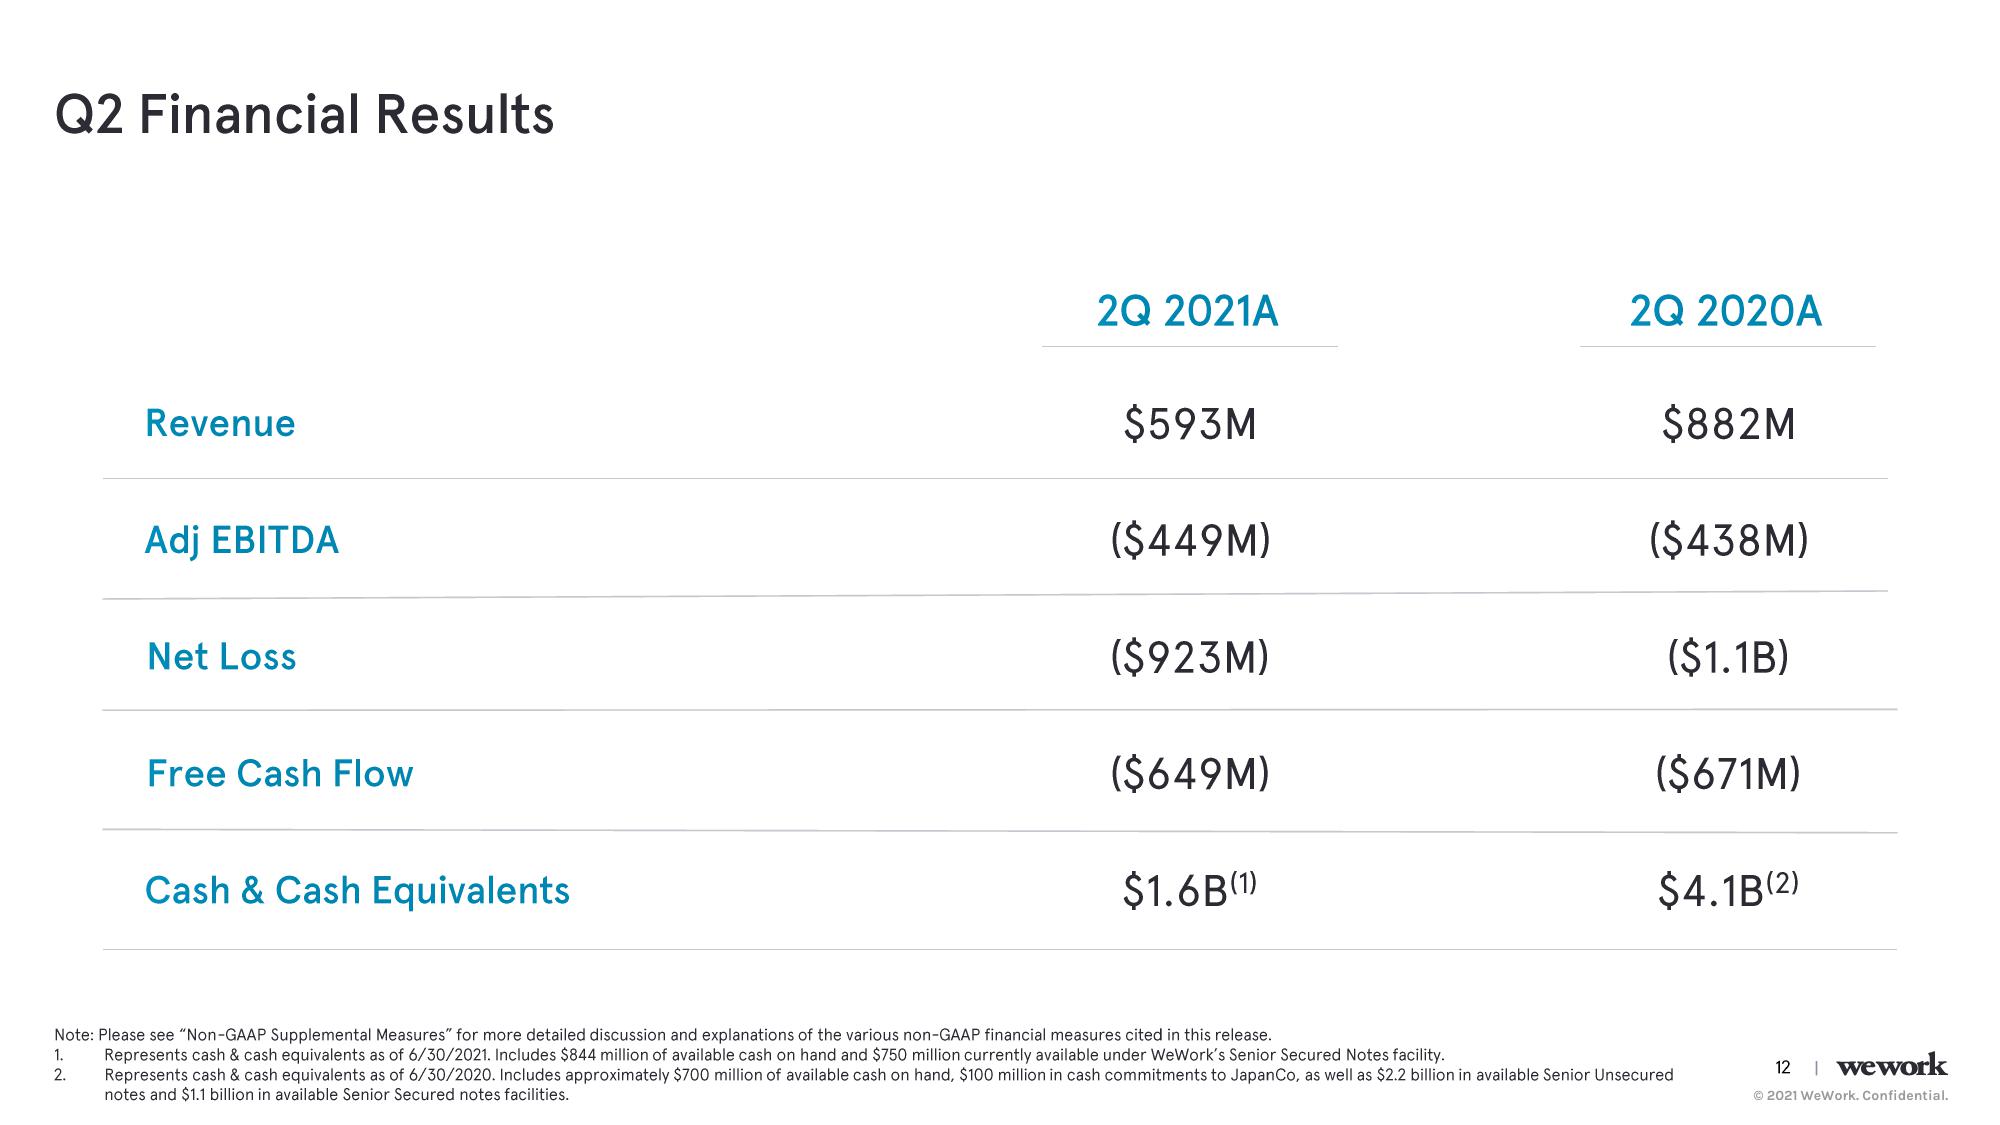
Revenue
1.
2.
Adj EBITDA
Net Loss
Free Cash Flow
Cash & Cash Equivalents
2Q 2021A
$593M
($449M)
($923M)
($649M)
$1.6B (1)
2Q 2020A
$882M
($438M)
($1.1B)
($671M)
$4.1B (2)
Note: Please see "Non-GAAP Supplemental Measures" for more detailed discussion and explanations of the various non-GAAP financial measures cited in this release.
Represents cash & cash equivalents as of 6/30/2021. Includes $844 million of available cash on hand and $750 million currently available under WeWork's Senior Secured Notes facility.
Represents cash & cash equivalents as of 6/30/2020. Includes approximately $700 million of available cash on hand, $100 million in cash commitments to Japan Co, as well as $2.2 billion in available Senior Unsecured
notes and $1.1 billion in available Senior Secured notes facilities.
12 | wework
Ⓒ2021 WeWork. Confidential.View entire presentation