Sonos Results Presentation Deck
Continued R&D Investment; S&M and G&A Leverage
Research and Development (GAAP)
Restructuring and related charges
Adjusted Research and Development (Non-GAAP)
% of revenue
Sales and Marketing (GAAP)
Restructuring and related charges
Adjusted Sales and Marketing (Non-GAAP)
% of revenue
General and Administrative (GAAP)
Restructuring and related charges
Legal and transaction related costs
Adjusted General and Administrative (Non-GAAP)
% of revenue
Total Operating Expenses (GAAP)
Restructuring and related charges
Legal and transaction related costs
Adjusted Operating Expenses (Non-GAAP)
% of revenue
FY20
$214.7
5.1
$209.6
15.8%
$263.5
19.8
$243.8
18.4%
$121.0
1.4
15.5
$104.1
7.8%
$599.2
26.3
15.5
$557.4
42.0%
FY19
$171.2
$171.2
13.6%
$247.6
$247.6
19.6%
$102.9
$102.9
8.2%
$521.6
$521.6
41.4%
Y/Y Change
25.4%
NM
22.4%
220 bps
6.4%
NM
(1.6)%
(120 bps)
17.6%
NM
NM
1.2%
(40 bps)
14.9%
NM
NM
6.9%
60 bps
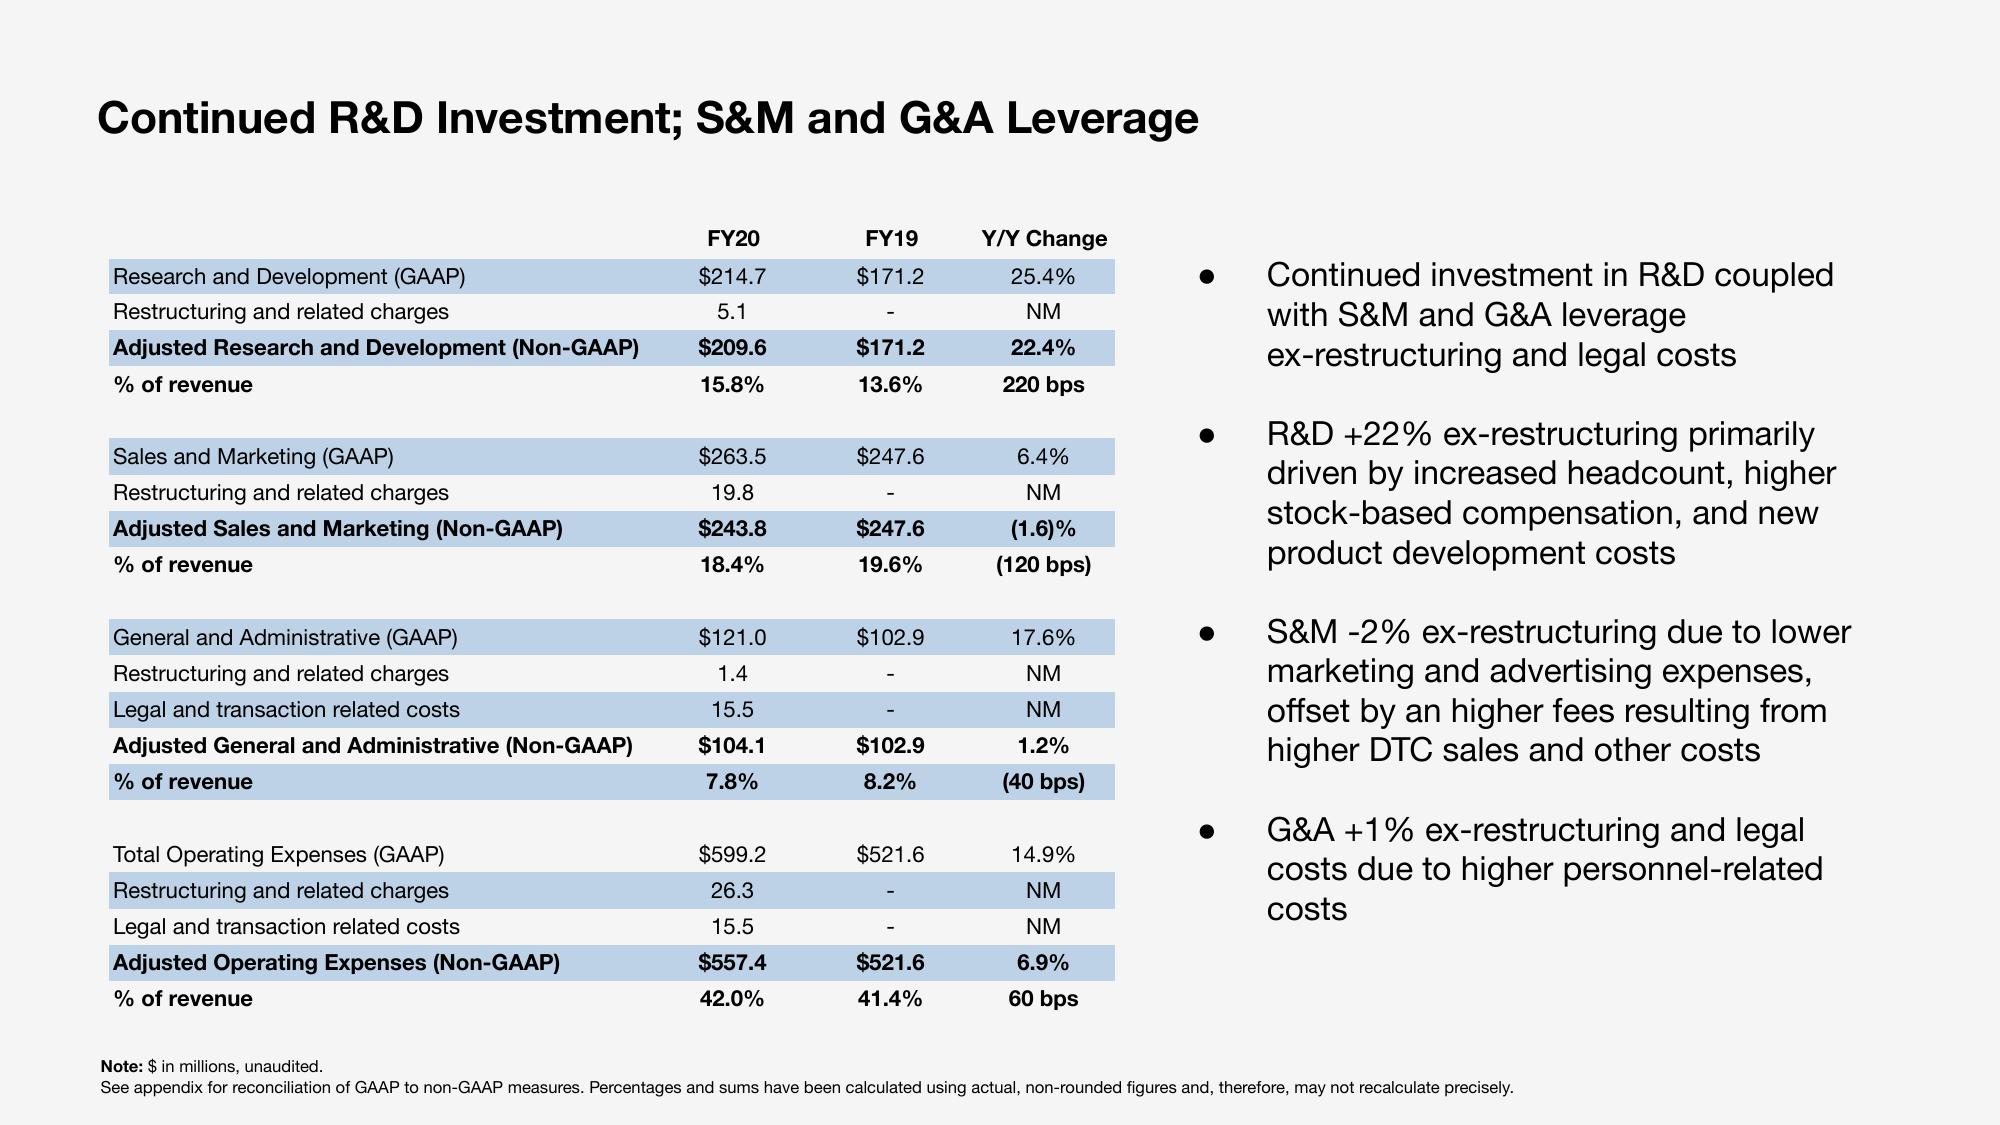
Continued investment in R&D coupled
with S&M and G&A leverage
ex-restructuring and legal costs
R&D +22% ex-restructuring primarily
driven by increased headcount, higher
stock-based compensation, and new
product development costs
S&M -2% ex-restructuring due to lower
marketing and advertising expenses,
offset by an higher fees resulting from
higher DTC sales and other costs
G&A +1% ex-restructuring and legal
costs due to higher personnel-related
costs
Note: $ in millions, unaudited.
See appendix for reconciliation of GAAP to non-GAAP measures. Percentages and sums have been calculated using actual, non-rounded figures and, therefore, may not recalculate precisely.View entire presentation