Weber Results Presentation Deck
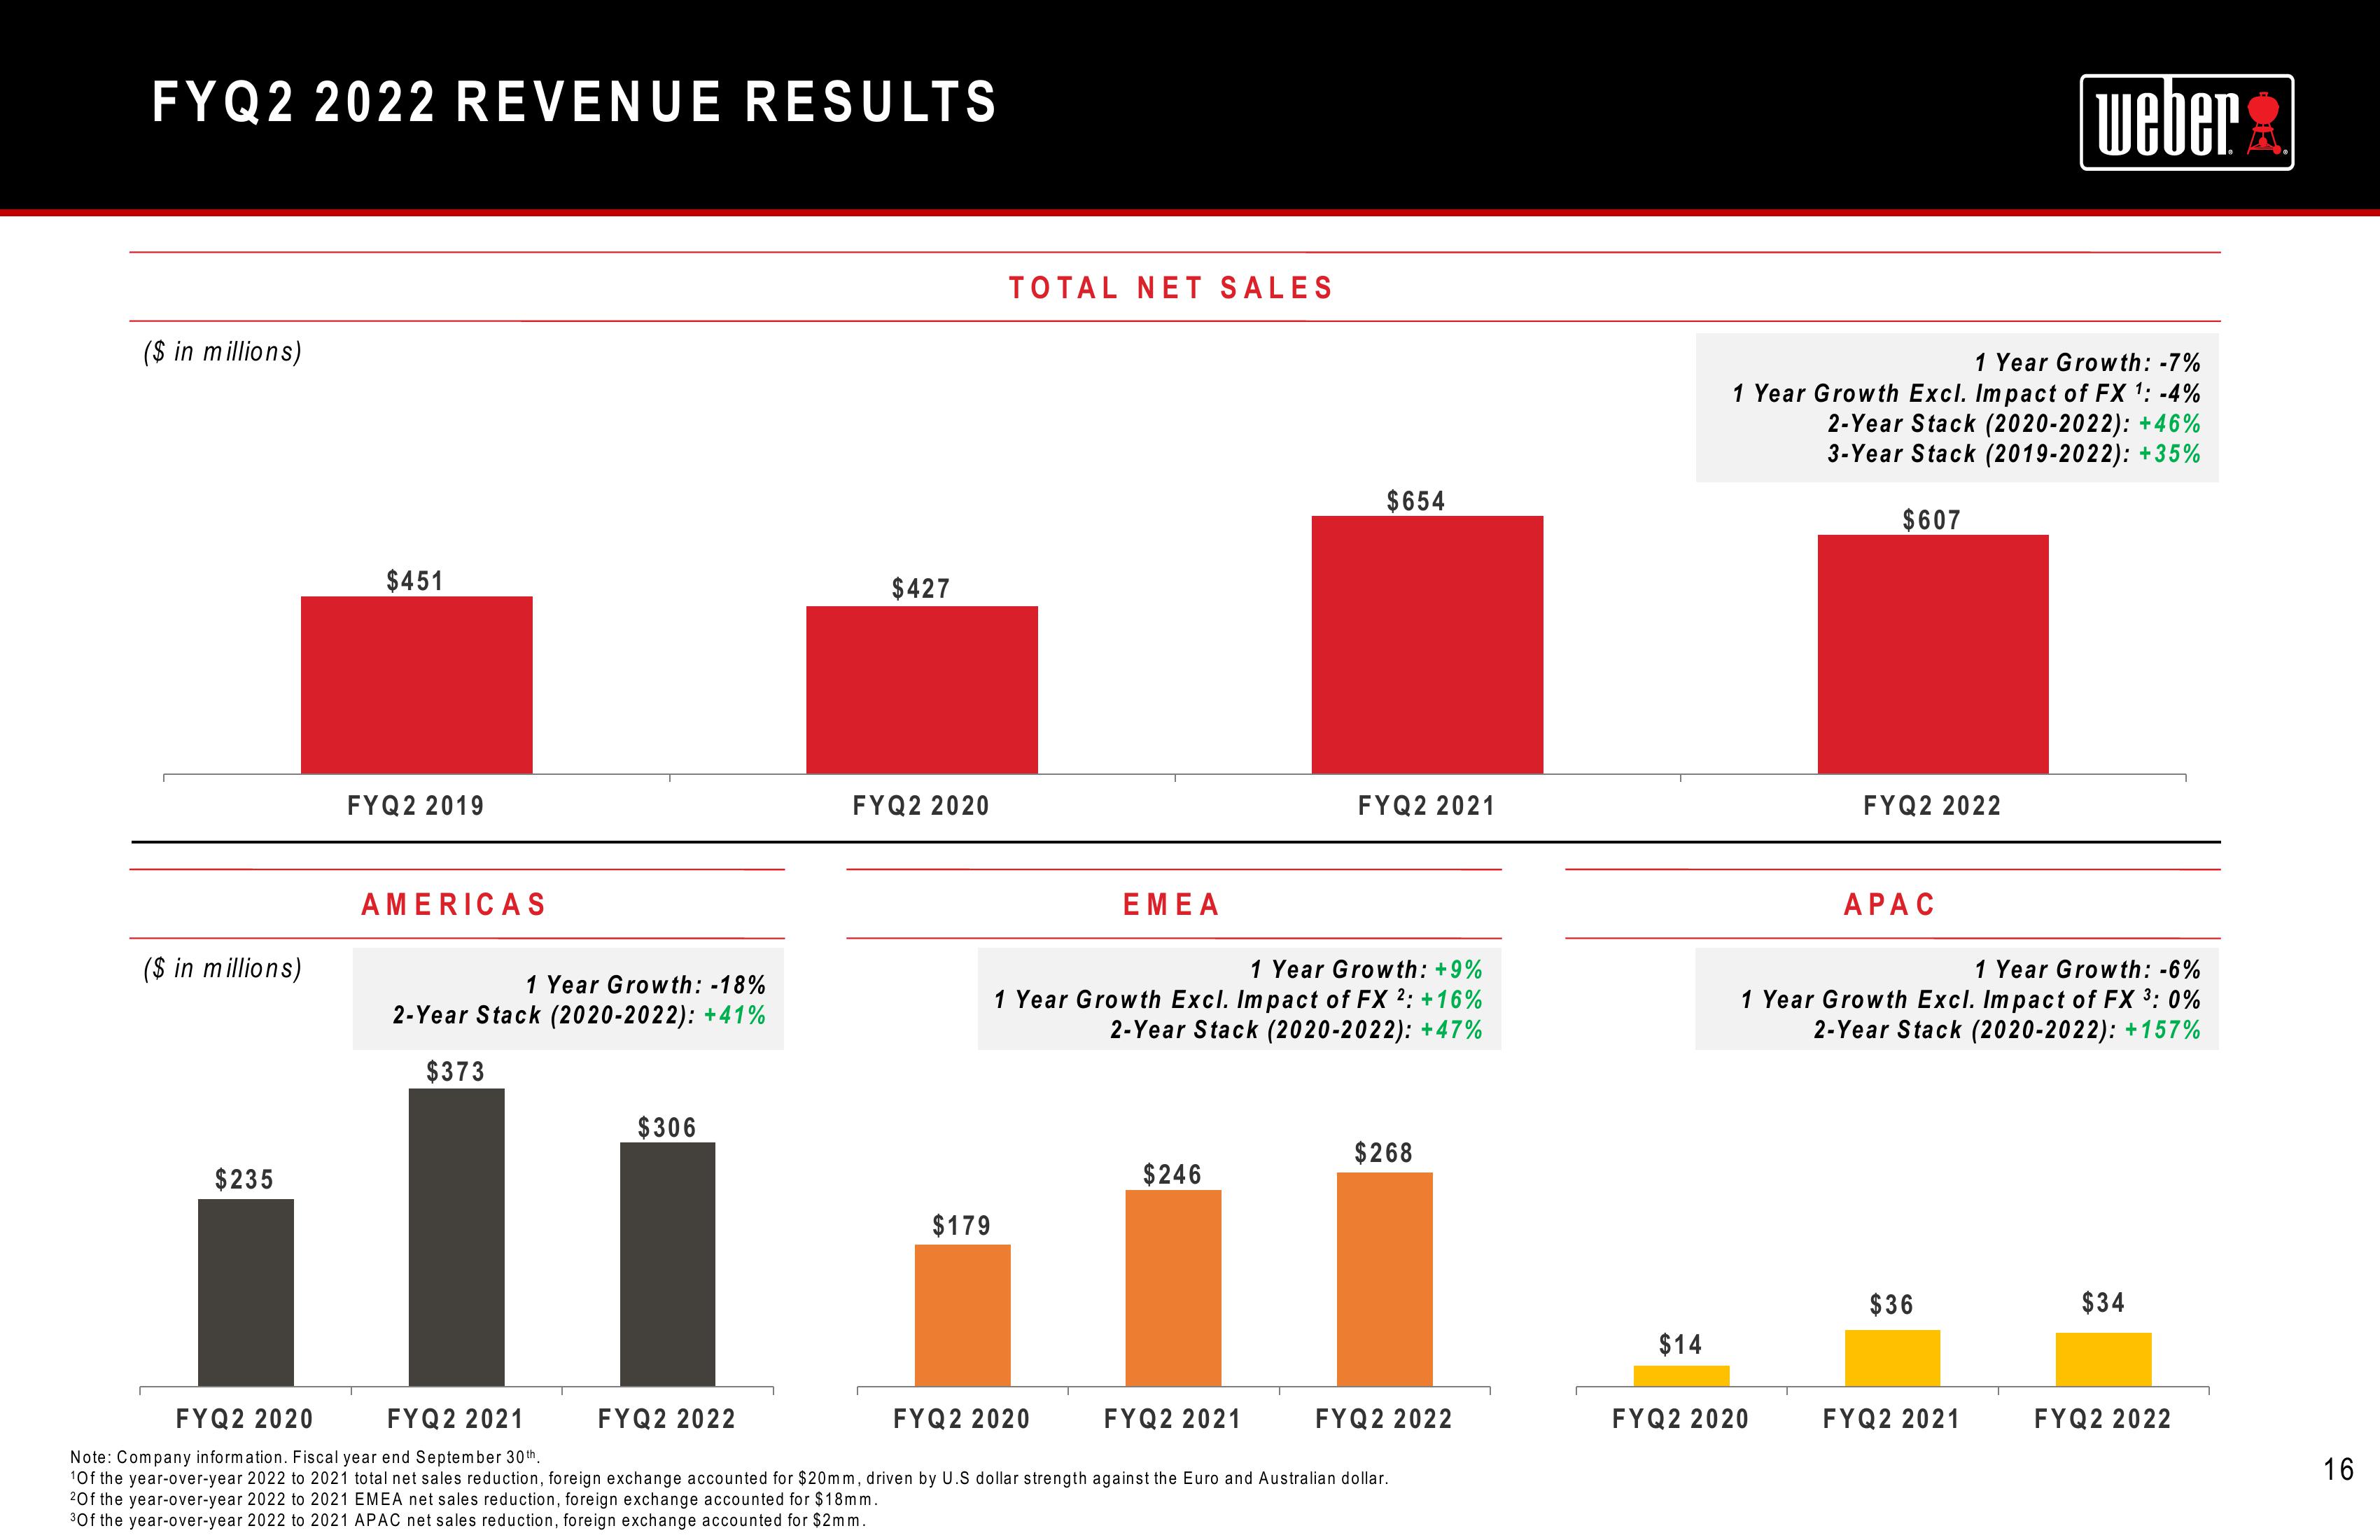
FYQ2 2022 REVENUE RESULTS
($ in millions)
($ in millions)
$235
$451
FYQ2 2019
AMERICAS
1 Year Growth: -18%
2-Year Stack (2020-2022): +41%
$373
$306
FYQ2 2022
$427
FYQ2 2020
$179
TOTAL NET SALES
ΕΜΕΑ
FYQ2 2020
1 Year Growth: +9%
1 Year Growth Excl. Impact of FX 2: +16%
2-Year Stack (2020-2022): +47%
$246
$654
FYQ2 2021
FYQ2 2021
FYQ2 2020 FYQ2 2021
Note: Company information. Fiscal year end September 30th,
¹Of the year-over-year 2022 to 2021 total net sales reduction, foreign exchange accounted for $20mm, driven by U.S dollar strength against the Euro and Australian dollar.
2Of the year-over-year 2022 to 2021 EMEA net sales reduction, foreign exchange accounted for $18mm.
3Of the year-over-year 2022 to 2021 APAC net sales reduction, foreign exchange accounted for $2mm.
$268
FYQ2 2022
$14
1 Year Growth: -7%
1 Year Growth Excl. Impact of FX ¹: -4%
2-Year Stack (2020-2022): +46%
3-Year Stack (2019-2022): +35%
$607
FYQ2 2022
FYQ2 2020
APAC
1 Year Growth: -6%
1 Year Growth Excl. Impact of FX ³: 0%
2-Year Stack (2020-2022): +157%
weber
$36
FYQ2 2021
$34
FYQ2 2022
16View entire presentation