Bakkt Results Presentation Deck
FINANCIAL RESULTS
Summary of FY22 condensed results.
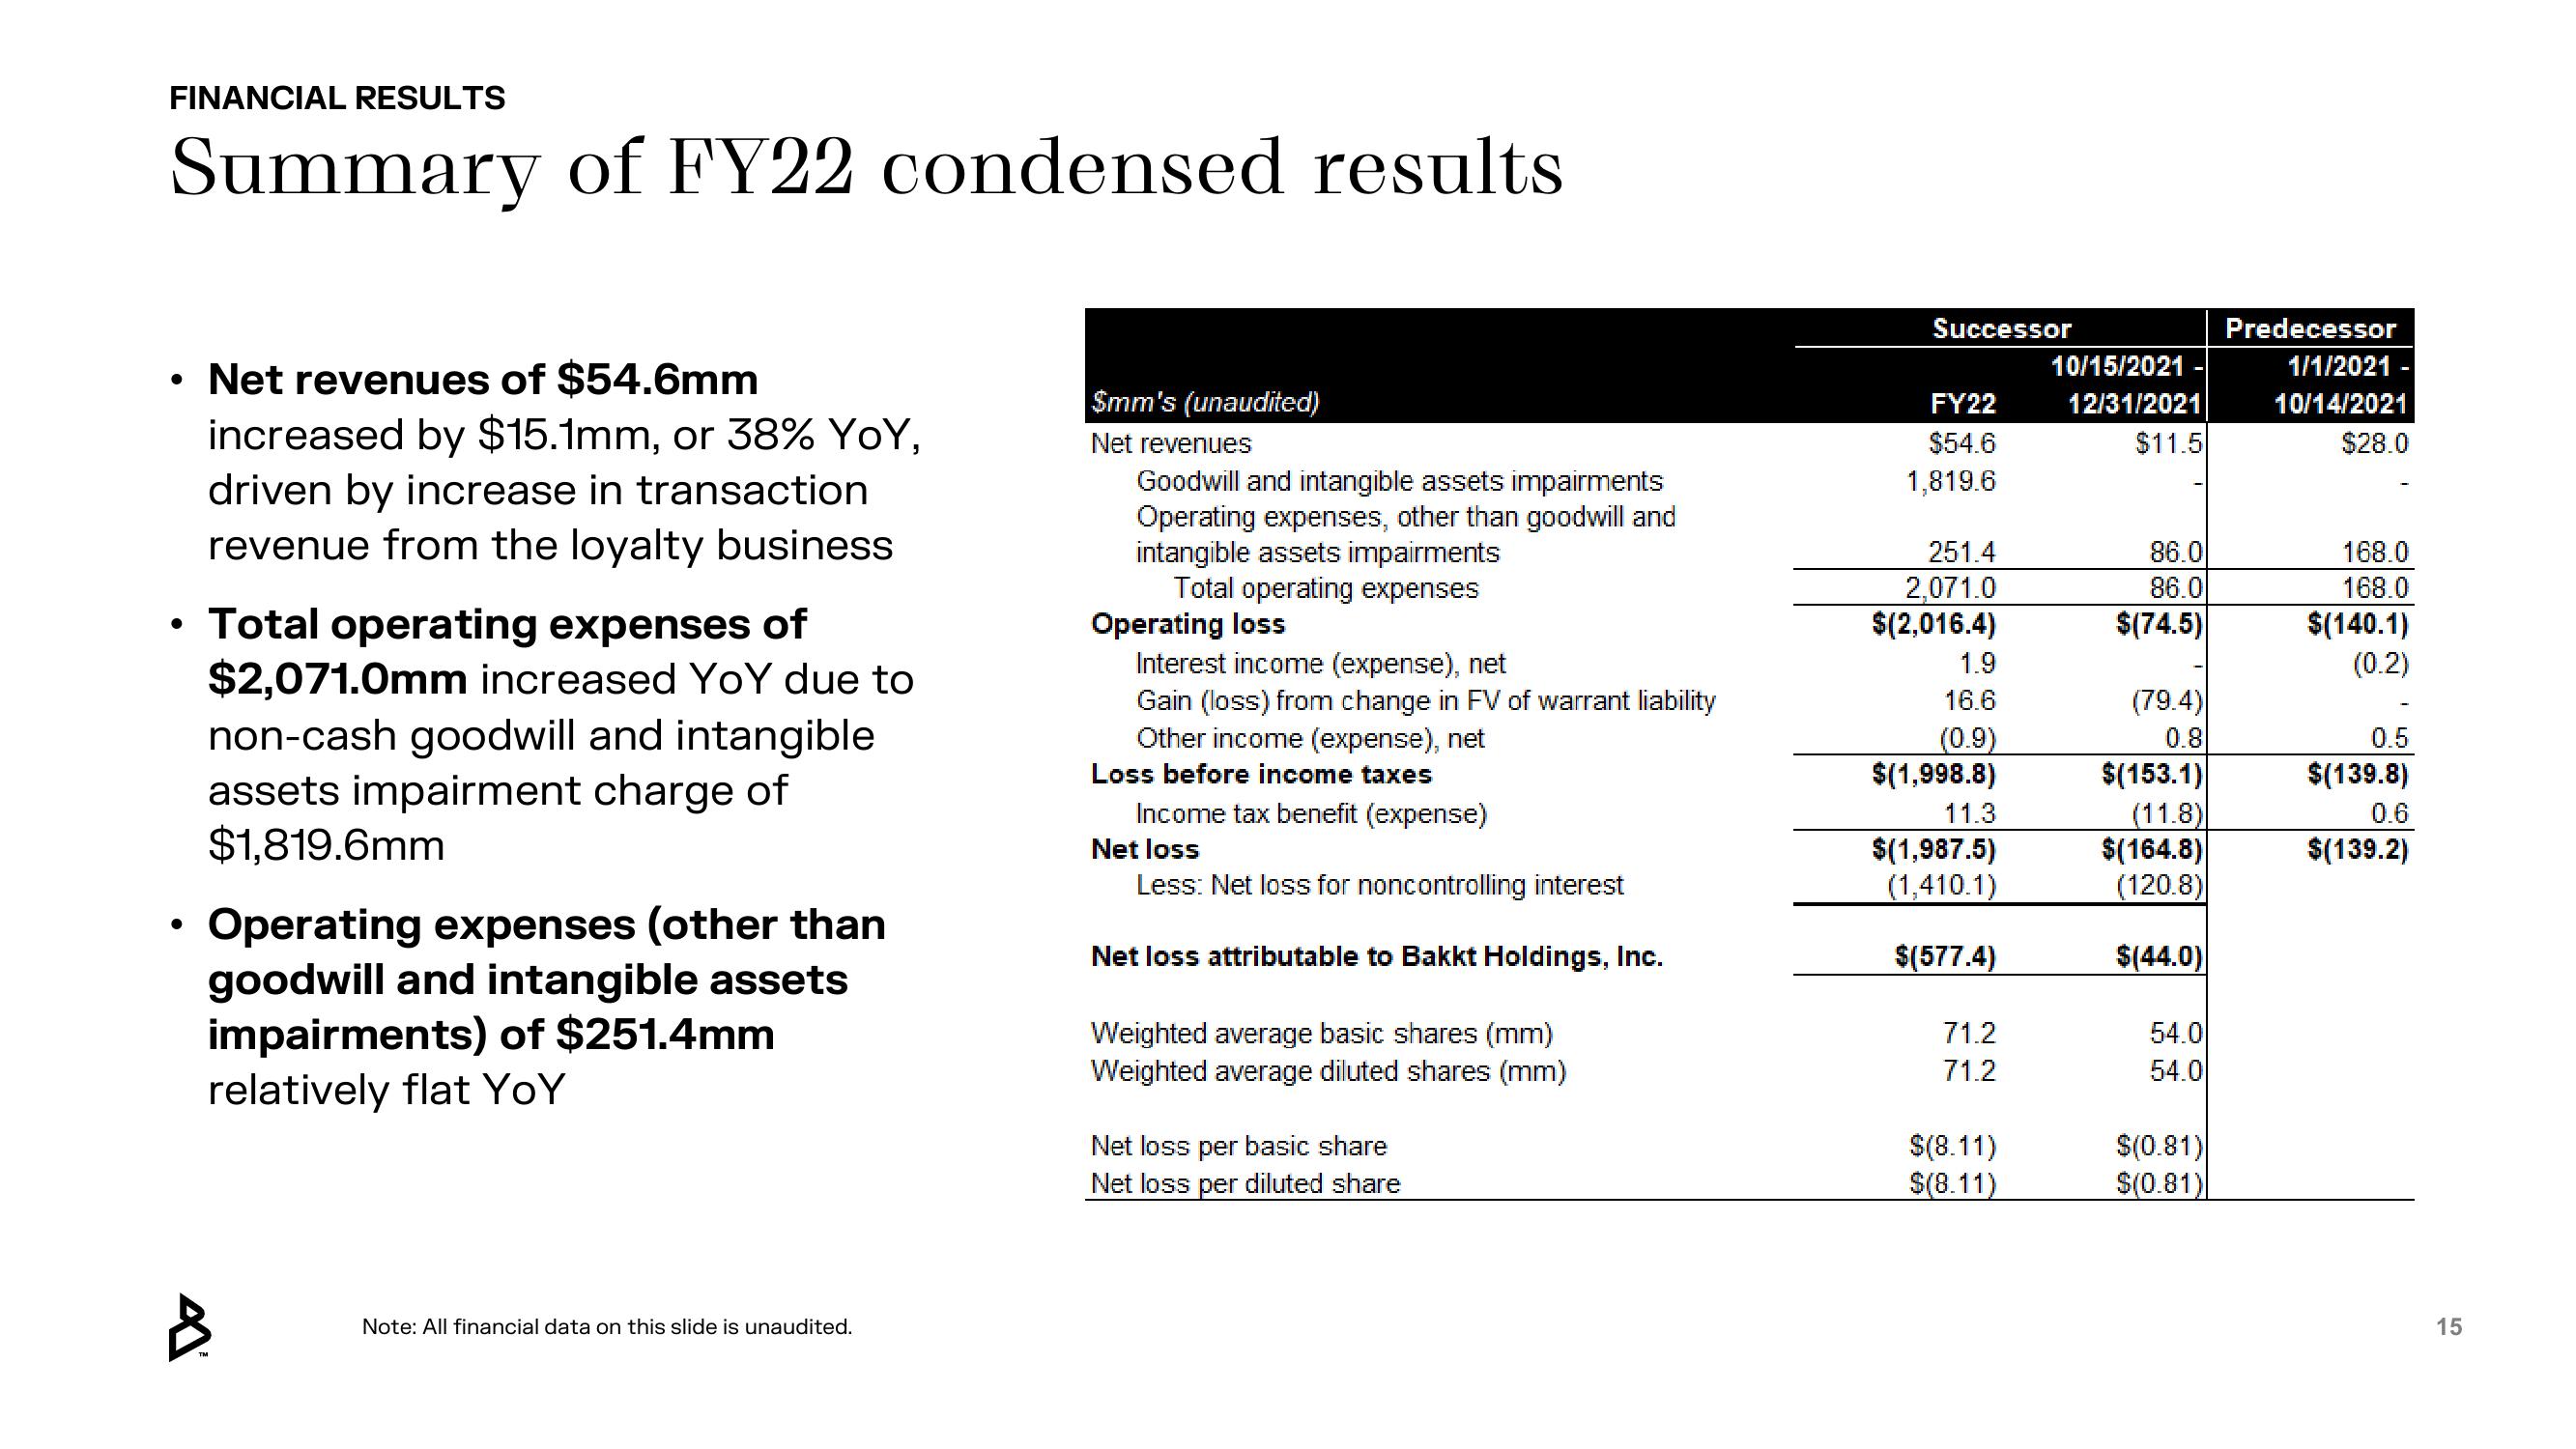
• Total operating expenses of
$2,071.0mm increased YoY due to
non-cash goodwill and intangible
assets impairment charge of
$1,819.6mm
●
Net revenues of $54.6mm
increased by $15.1mm, or 38% YoY,
driven by increase in transaction
revenue from the loyalty business
Operating expenses (other than
goodwill and intangible assets
impairments) of $251.4mm
relatively flat YoY
A
Note: All financial data on this slide is unaudited.
$mm's (unaudited)
Net revenues
Goodwill and intangible assets impairments
Operating expenses, other than goodwill and
intangible assets impairments
Total operating expenses
Operating loss
Interest income (expense), net
Gain (loss) from change in FV of warrant liability
Other income (expense), net
Loss before income taxes
Income tax benefit (expense)
Net loss
Less: Net loss for noncontrolling interest
Net loss attributable to Bakkt Holdings, Inc.
Weighted average basic shares (mm)
Weighted average diluted shares (mm)
Net loss per basic share
Net loss per diluted share
Successor
FY22
$54.6
1,819.6
251.4
2,071.0
$(2,016.4)
1.9
16.6
(0.9)
$(1,998.8)
11.3
$(1,987.5)
(1,410.1)
$(577.4)
71.2
71.2
$(8.11)
$(8.11)
10/15/2021-
12/31/2021
$11.5
86.0
86.0
$(74.5)
(79.4)
0.8
$(153.1)
(11.8)
$(164.8)
(120.8)
$(44.0)
54.0
54.0
$(0.81)
$(0.81)
Predecessor
1/1/2021 -
10/14/2021
$28.0
168.0
168.0
$(140.1)
(0.2)
0.5
$(139.8)
0.6
$(139.2)
15View entire presentation