Adani Green Energy Limited
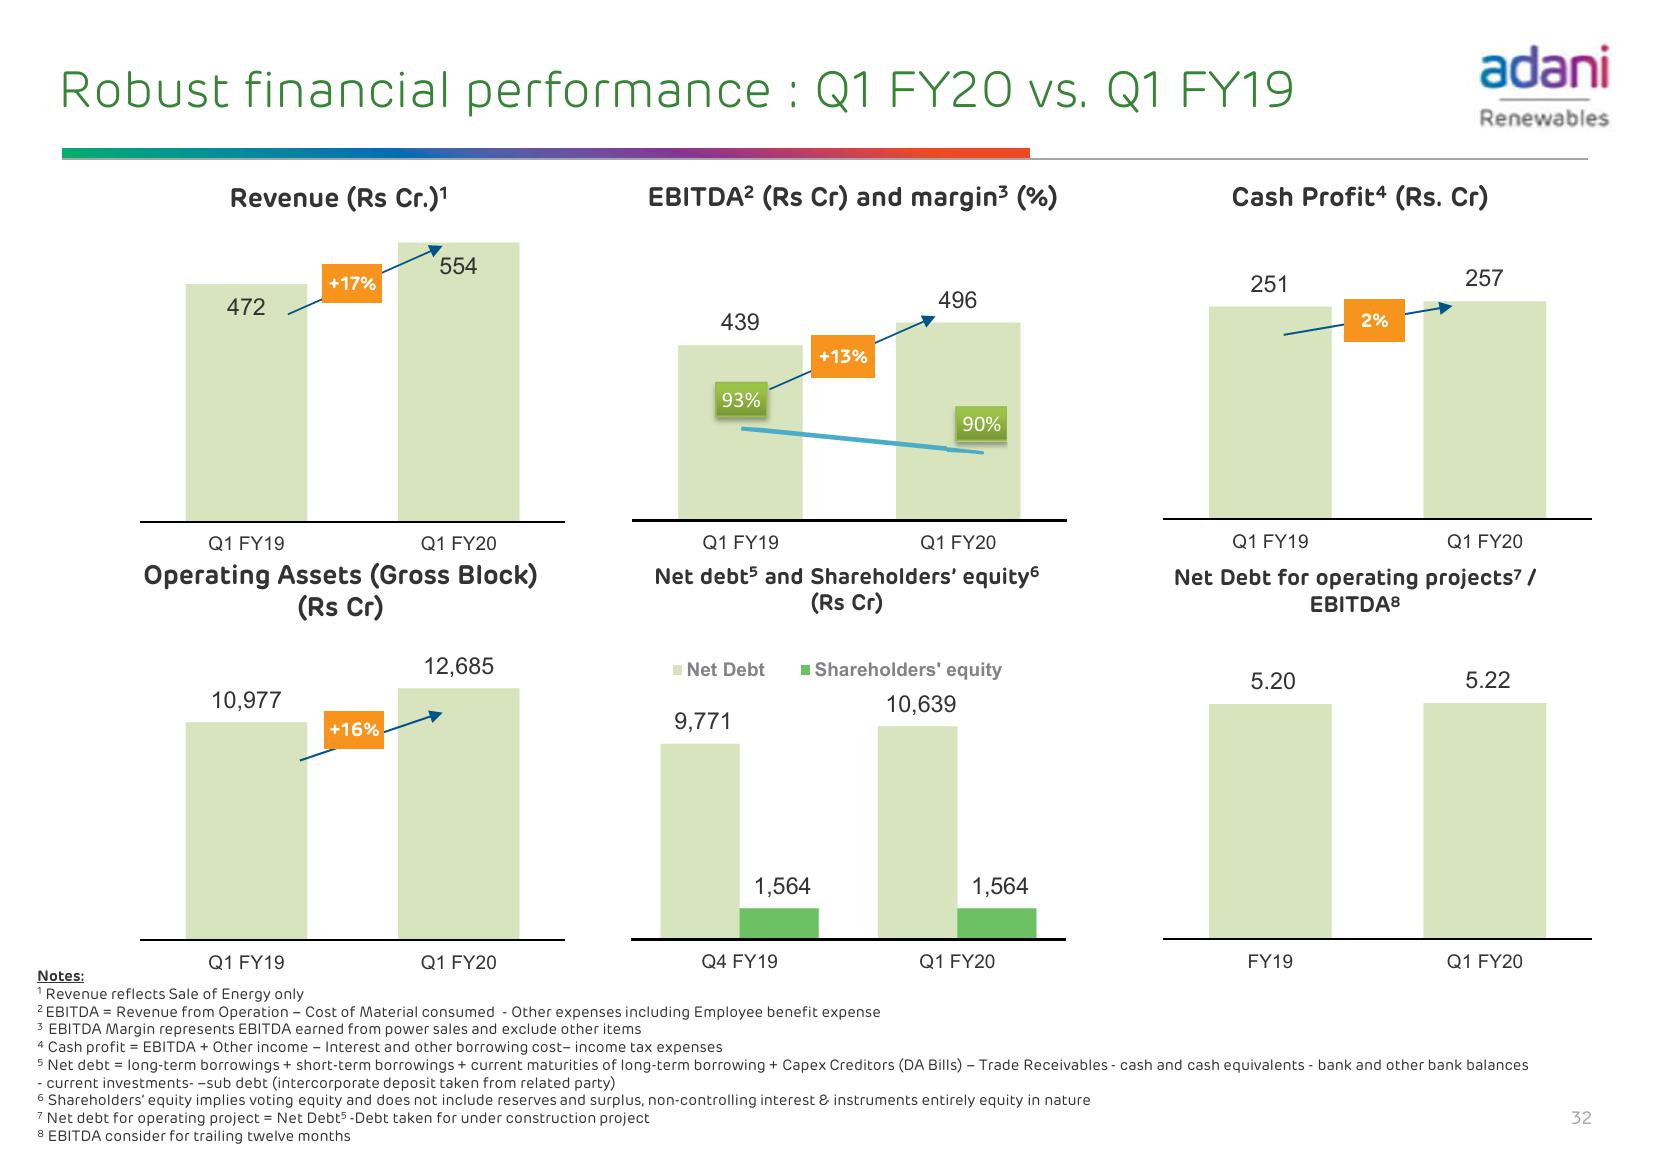
Robust financial performance: Q1 FY20 vs. Q1 FY19
Revenue (Rs Cr.)1
EBITDA2 (Rs Cr) and margin³ (%)
Cash Profit (Rs. Cr)
Notes:
554
+17%
472
439
+13%
93%
496
90%
Q1 FY19
Q1 FY20
Operating Assets (Gross Block)
(Rs Cr)
Q1 FY19
Q1 FY20
Net debt and Shareholders' equity6
(Rs Cr)
12,685
Net Debt
Shareholders' equity
10,977
+16%
10,639
9,771
Q1 FY19
Q1 FY20
1,564
Q4 FY19
1,564
Q1 FY20
adani
Renewables
251
257
2%
Q1 FY19
Q1 FY20
Net Debt for operating projects? /
5.20
EBITDA8
5.22
FY19
Q1 FY20
Revenue reflects Sale of Energy only
2 EBITDA Revenue from Operation Cost of Material consumed
Other expenses including Employee benefit expense
3 EBITDA Margin represents EBITDA earned from power sales and exclude other items
4 Cash profit = EBITDA + Other income - Interest and other borrowing cost- income tax expenses
5 Net debt long-term borrowings + short-term borrowings + current maturities of long-term borrowing + Capex Creditors (DA Bills) - Trade Receivables - cash and cash equivalents - bank and other bank balances
- current investments--sub debt (intercorporate deposit taken from related party)
6 Shareholders' equity implies voting equity and does not include reserves and surplus, non-controlling interest & instruments entirely equity in nature
7 Net debt for operating project = Net Debt5 -Debt taken for under construction project
8 EBITDA consider for trailing twelve months
32View entire presentation