HBT Financial Results Presentation Deck
Non-GAAP Reconciliations (cont'd)
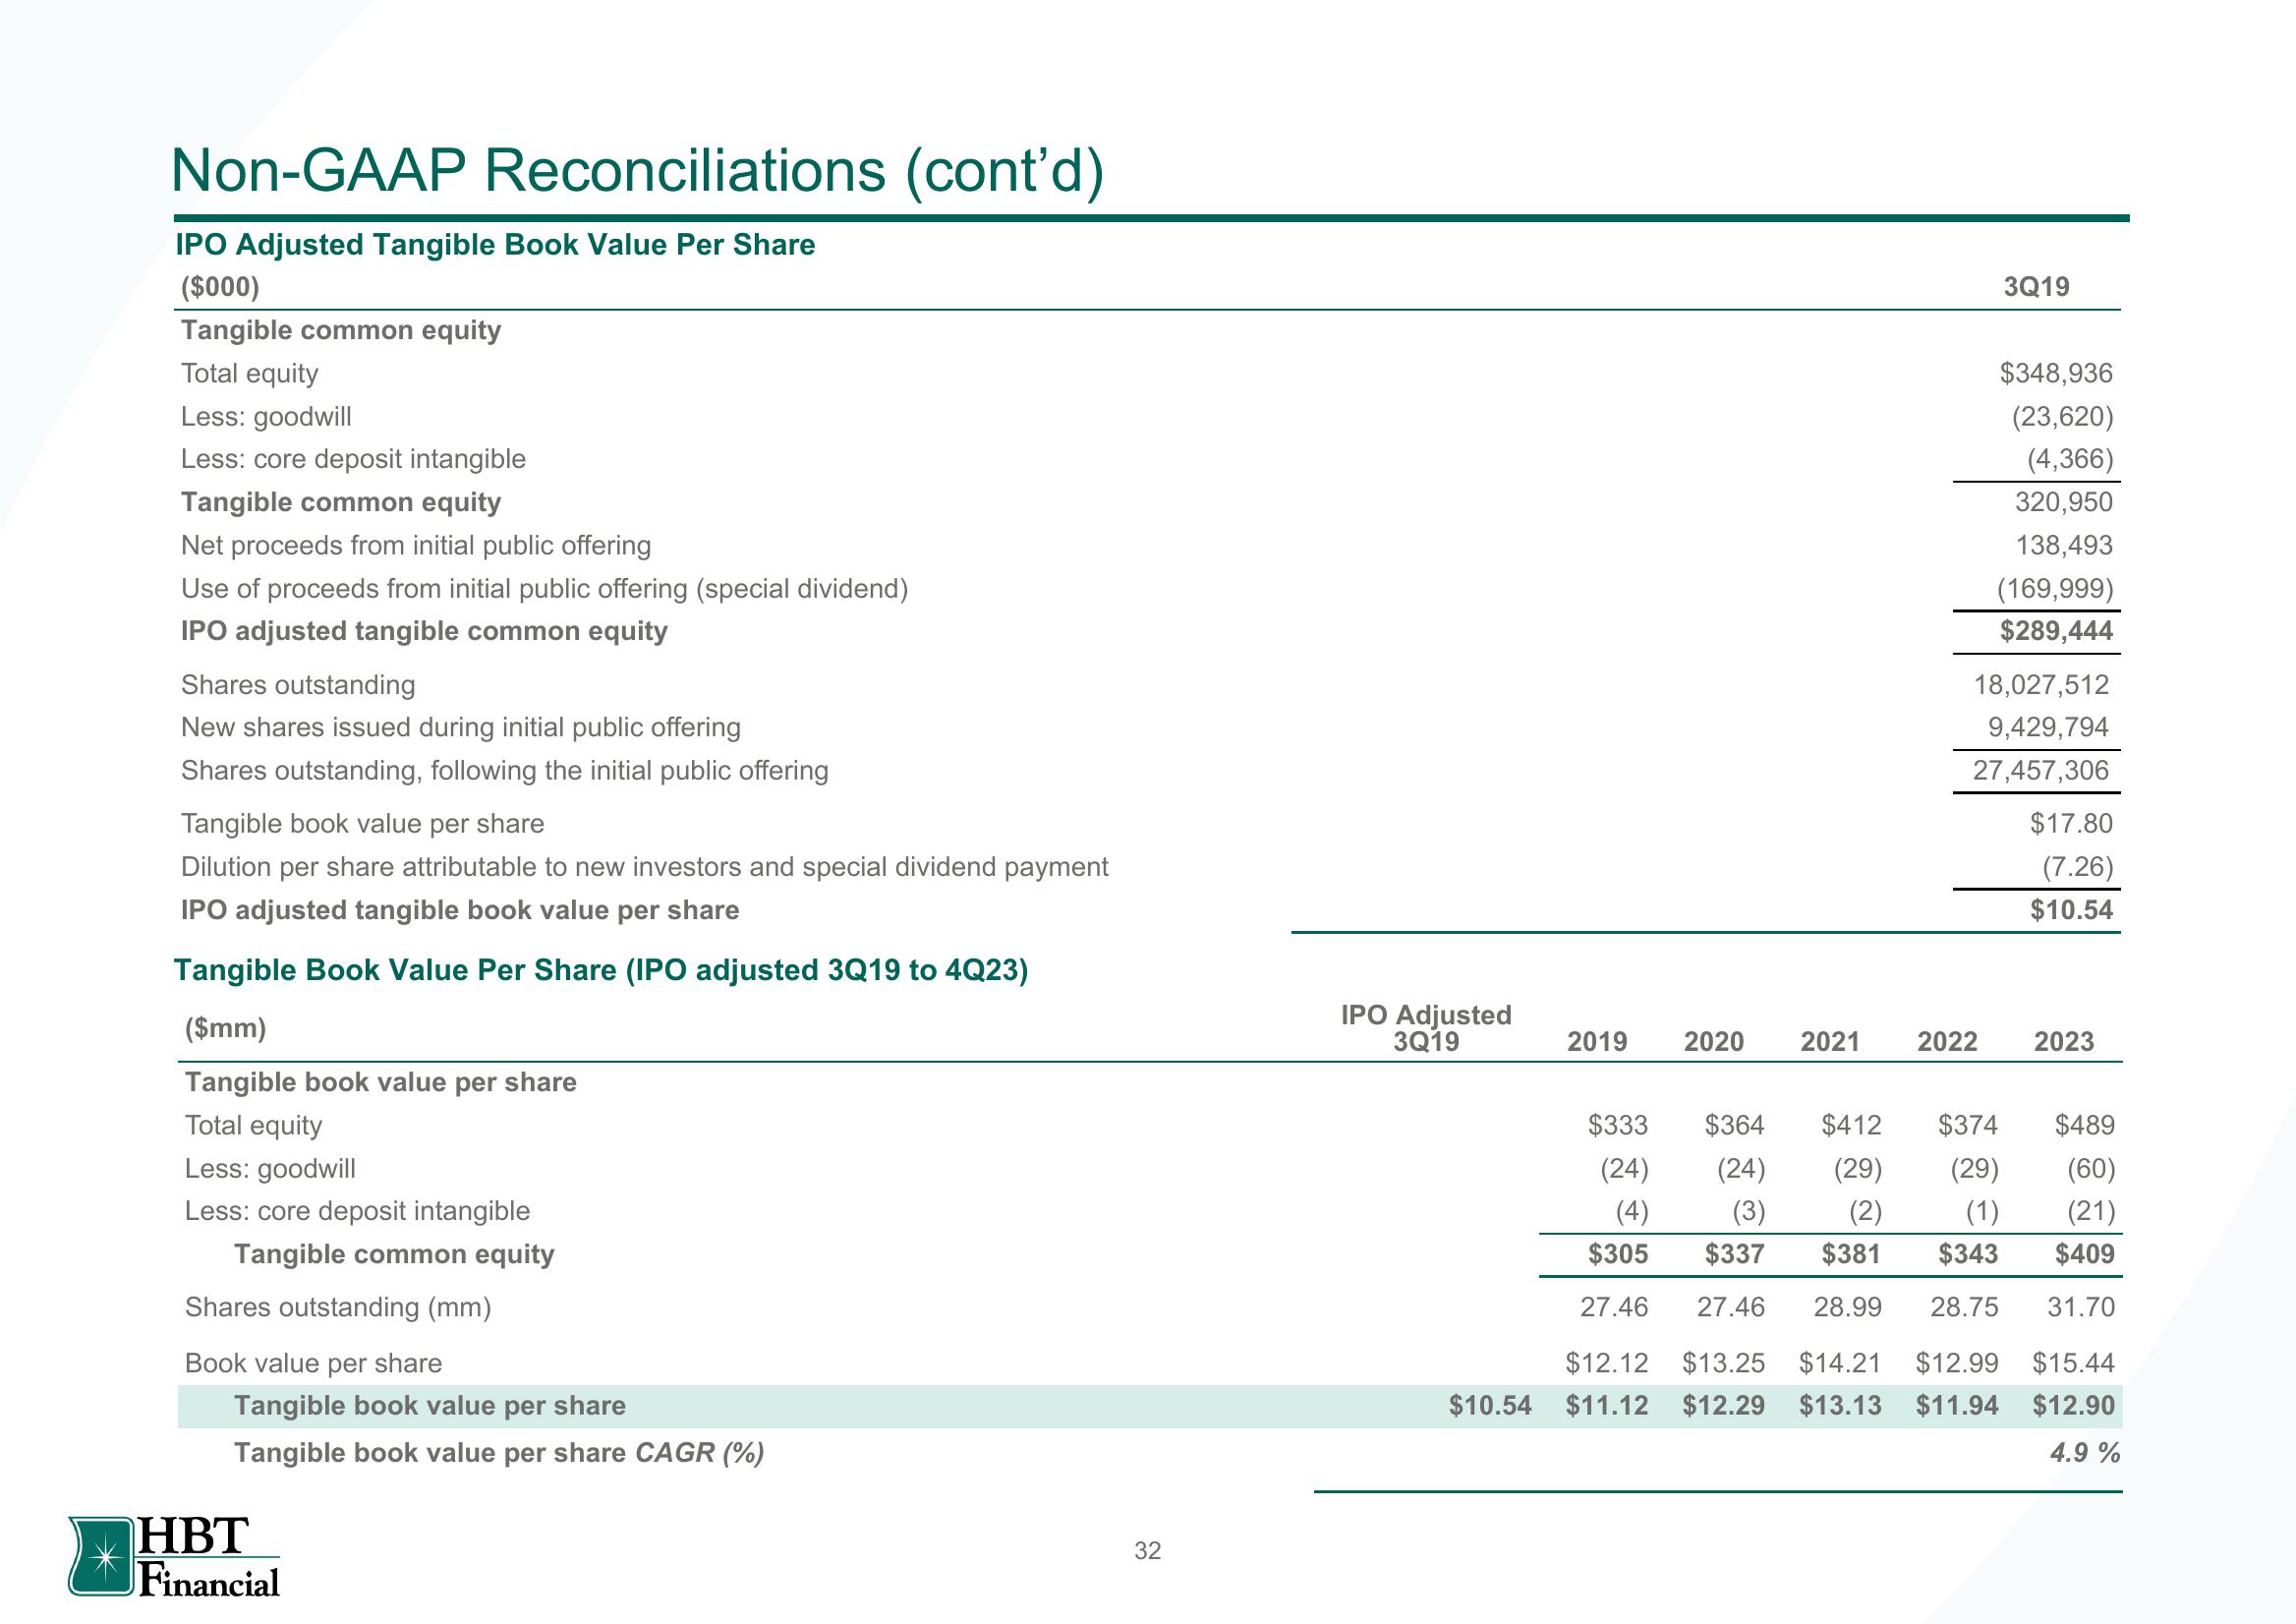
IPO Adjusted Tangible Book Value Per Share
($000)
Tangible common equity
Total equity
Less: goodwill
Less: core deposit intangible
Tangible common equity
Net proceeds from initial public offering
Use of proceeds from initial public offering (special dividend)
IPO adjusted tangible common equity
Shares outstanding
New shares issued during initial public offering
Shares outstanding, following the initial public offering
Tangible book value per share
Dilution per share attributable to new investors and special dividend payment
IPO adjusted tangible book value per share
Tangible Book Value Per Share (IPO adjusted 3Q19 to 4Q23)
($mm)
Tangible book value per share
Total equity
Less: goodwill
Less: core deposit intangible
Tangible common equity
Shares outstanding (mm)
Book value per share
Tangible book value per share
Tangible book value per share CAGR (%)
HBT
Financial
32
IPO Adjusted
3Q19
2019
3Q19
2020 2021 2022
$348,936
(23,620)
(4,366)
320,950
138,493
(169,999)
$289,444
18,027,512
9,429,794
27,457,306
$17.80
(7.26)
$10.54
2023
$333 $364 $412 $374
(24)
(4)
(24)
(3)
$337
(29) (29)
(2) (1)
$381 $343
$305
27.46
27.46 28.99 28.75
$12.12 $13.25 $14.21 $12.99 $15.44
$10.54 $11.12 $12.29 $13.13 $11.94 $12.90
4.9 %
$489
(60)
(21)
$409
31.70View entire presentation