Perfect SPAC Presentation Deck
PERFECT
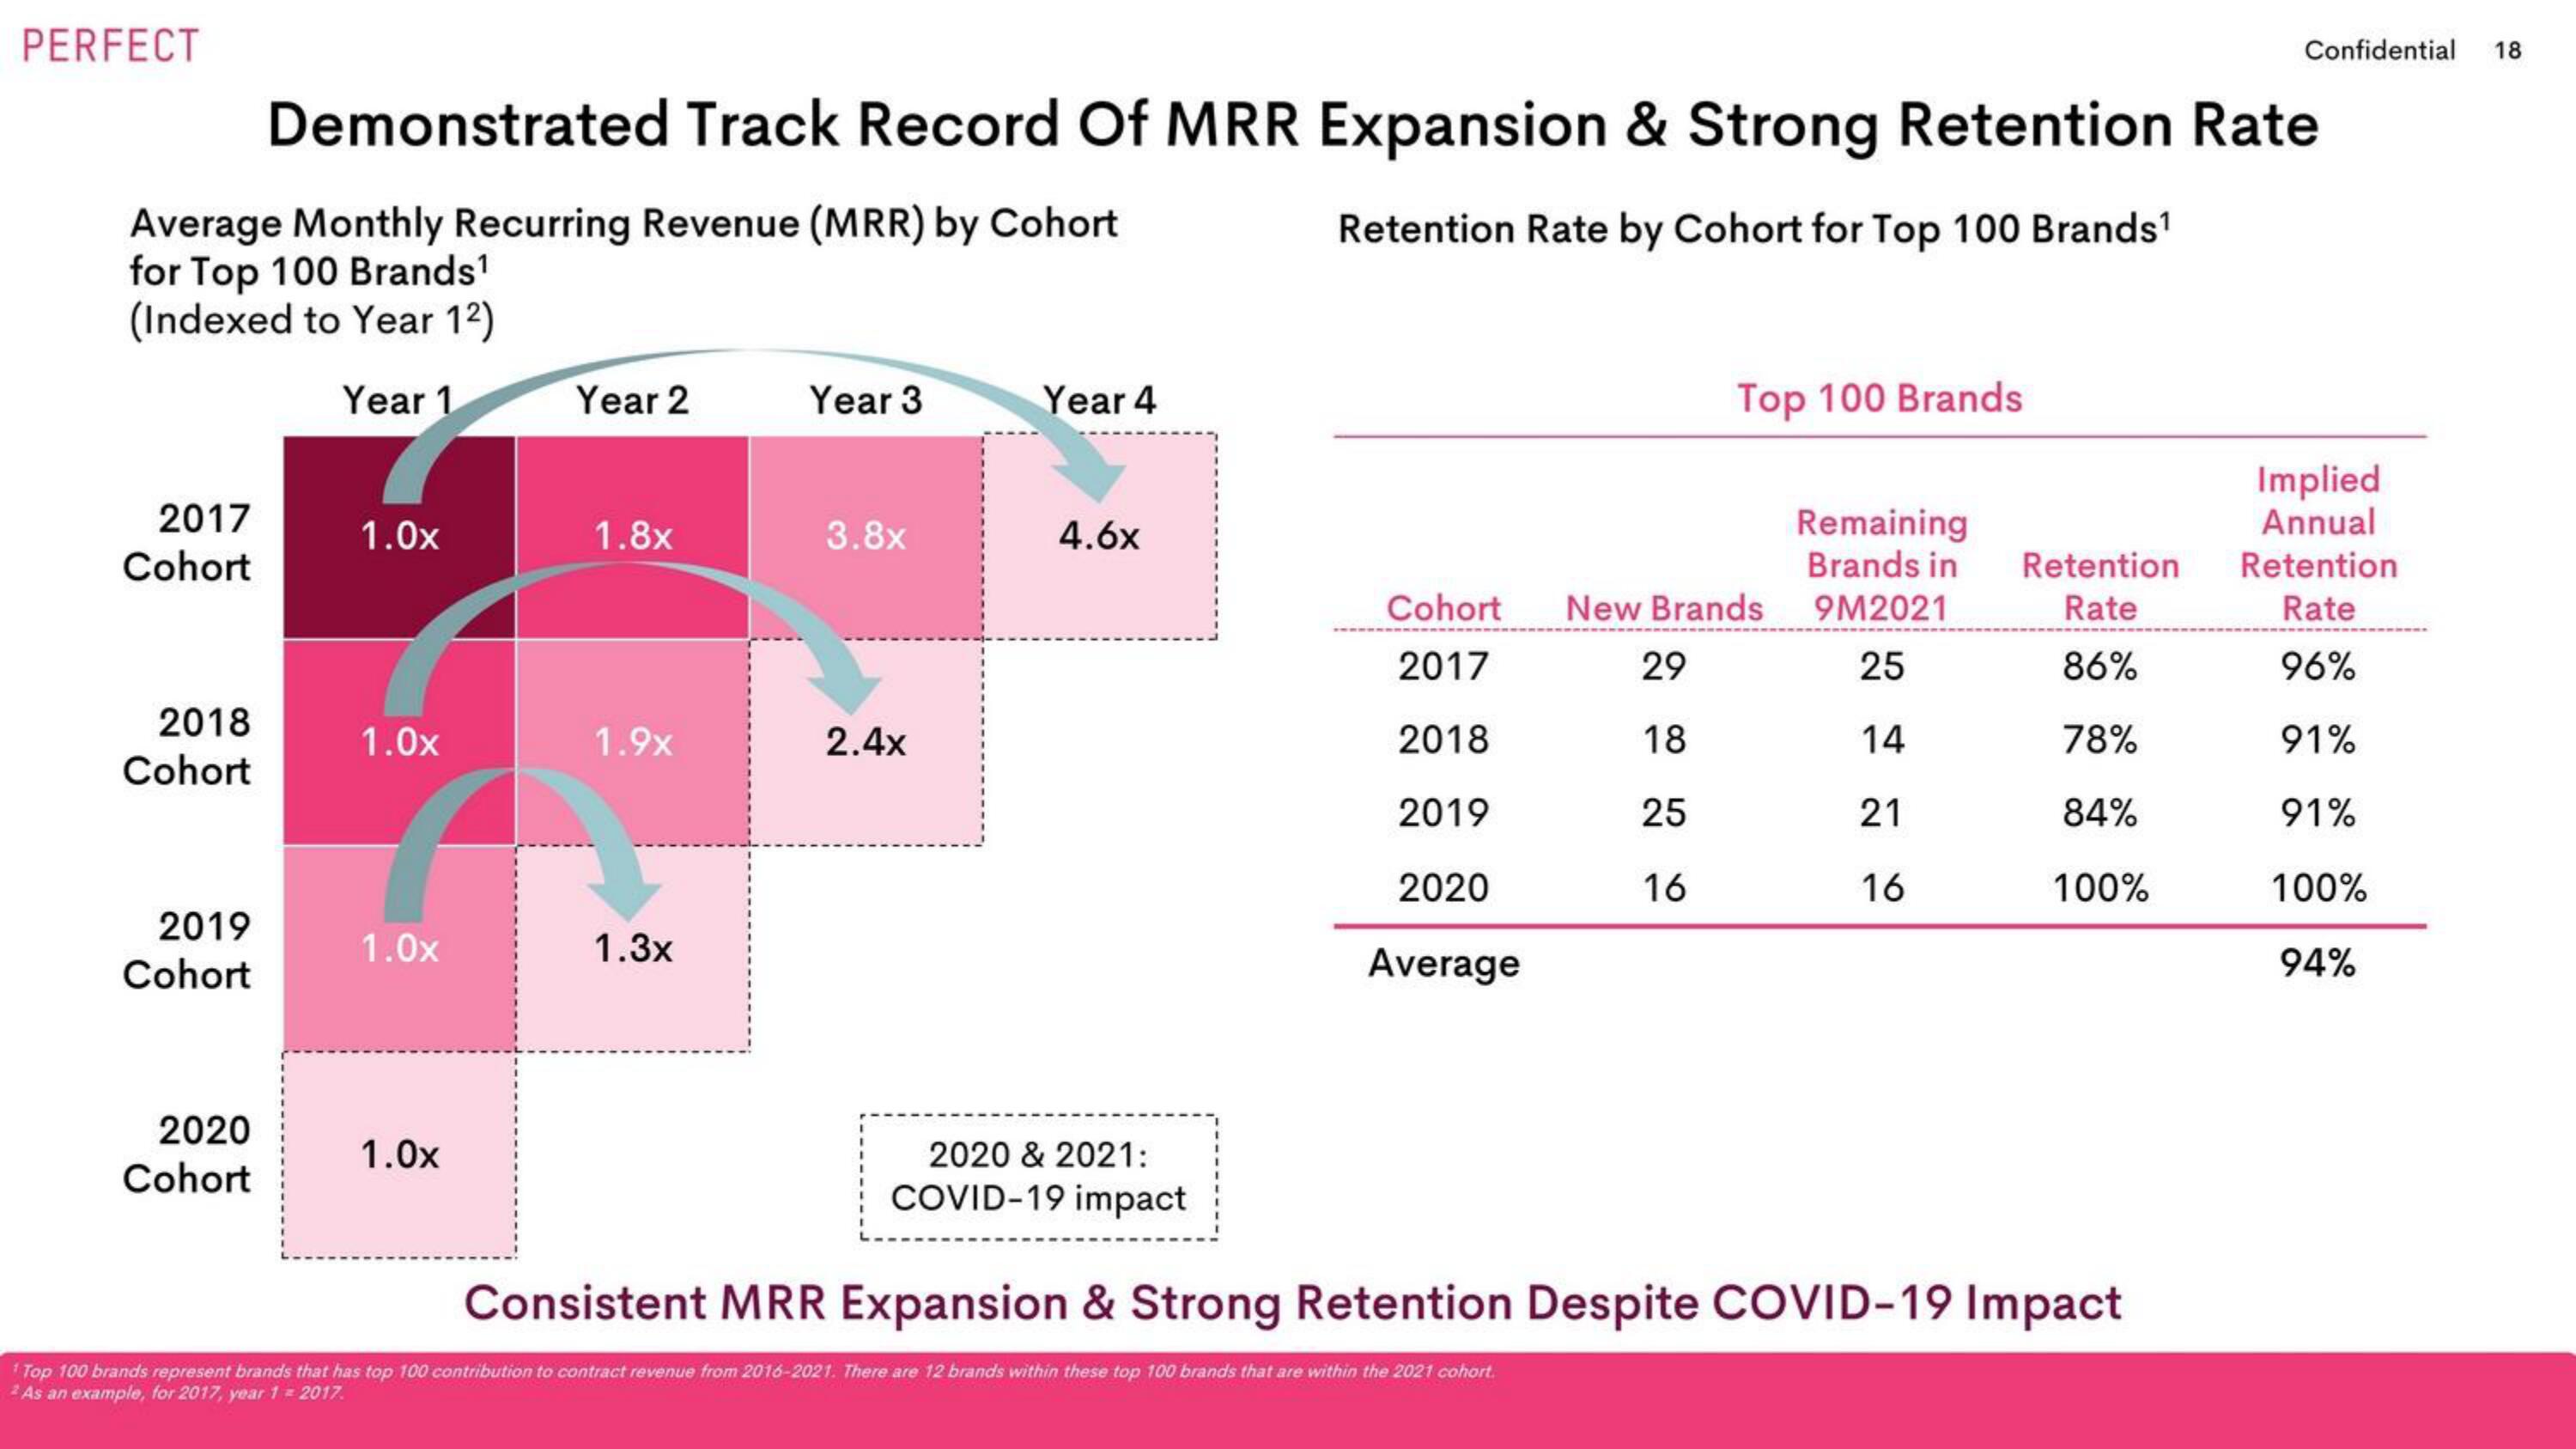
Demonstrated Track Record Of MRR Expansion & Strong Retention Rate
Average Monthly Recurring Revenue (MRR) by Cohort
for Top 100 Brands¹
Retention Rate by Cohort for Top 100 Brands¹
(Indexed to Year 1²)
Year 1
2017
Cohort
2018
Cohort
2019
Cohort
2020
Cohort
1.0x
1.0x
1.0x
1.0x
Year 2
1.8x
1.9x
1.3x
Year 3
3.8x
2.4x
Year 4
4.6x
2020 & 2021:
COVID-19 impact
Top 100 Brands
Cohort New Brands
2017
29
2018
18
2019
25
2020
16
Average
1 Top 100 brands represent brands that has top 100 contribution to contract revenue from 2016-2021. There are 12 brands within these top 100 brands that are within the 2021 cohort.
2As an example, for 2017, year 1 = 2017.
Remaining
Brands in
9M2021
25
14
21
16
Retention
Rate
86%
78%
84%
100%
Consistent MRR Expansion & Strong Retention Despite COVID-19 Impact
Confidential 18
Implied
Annual
Retention
Rate
96%
91%
91%
100%
94%View entire presentation