Silicon Valley Bank Results Presentation Deck
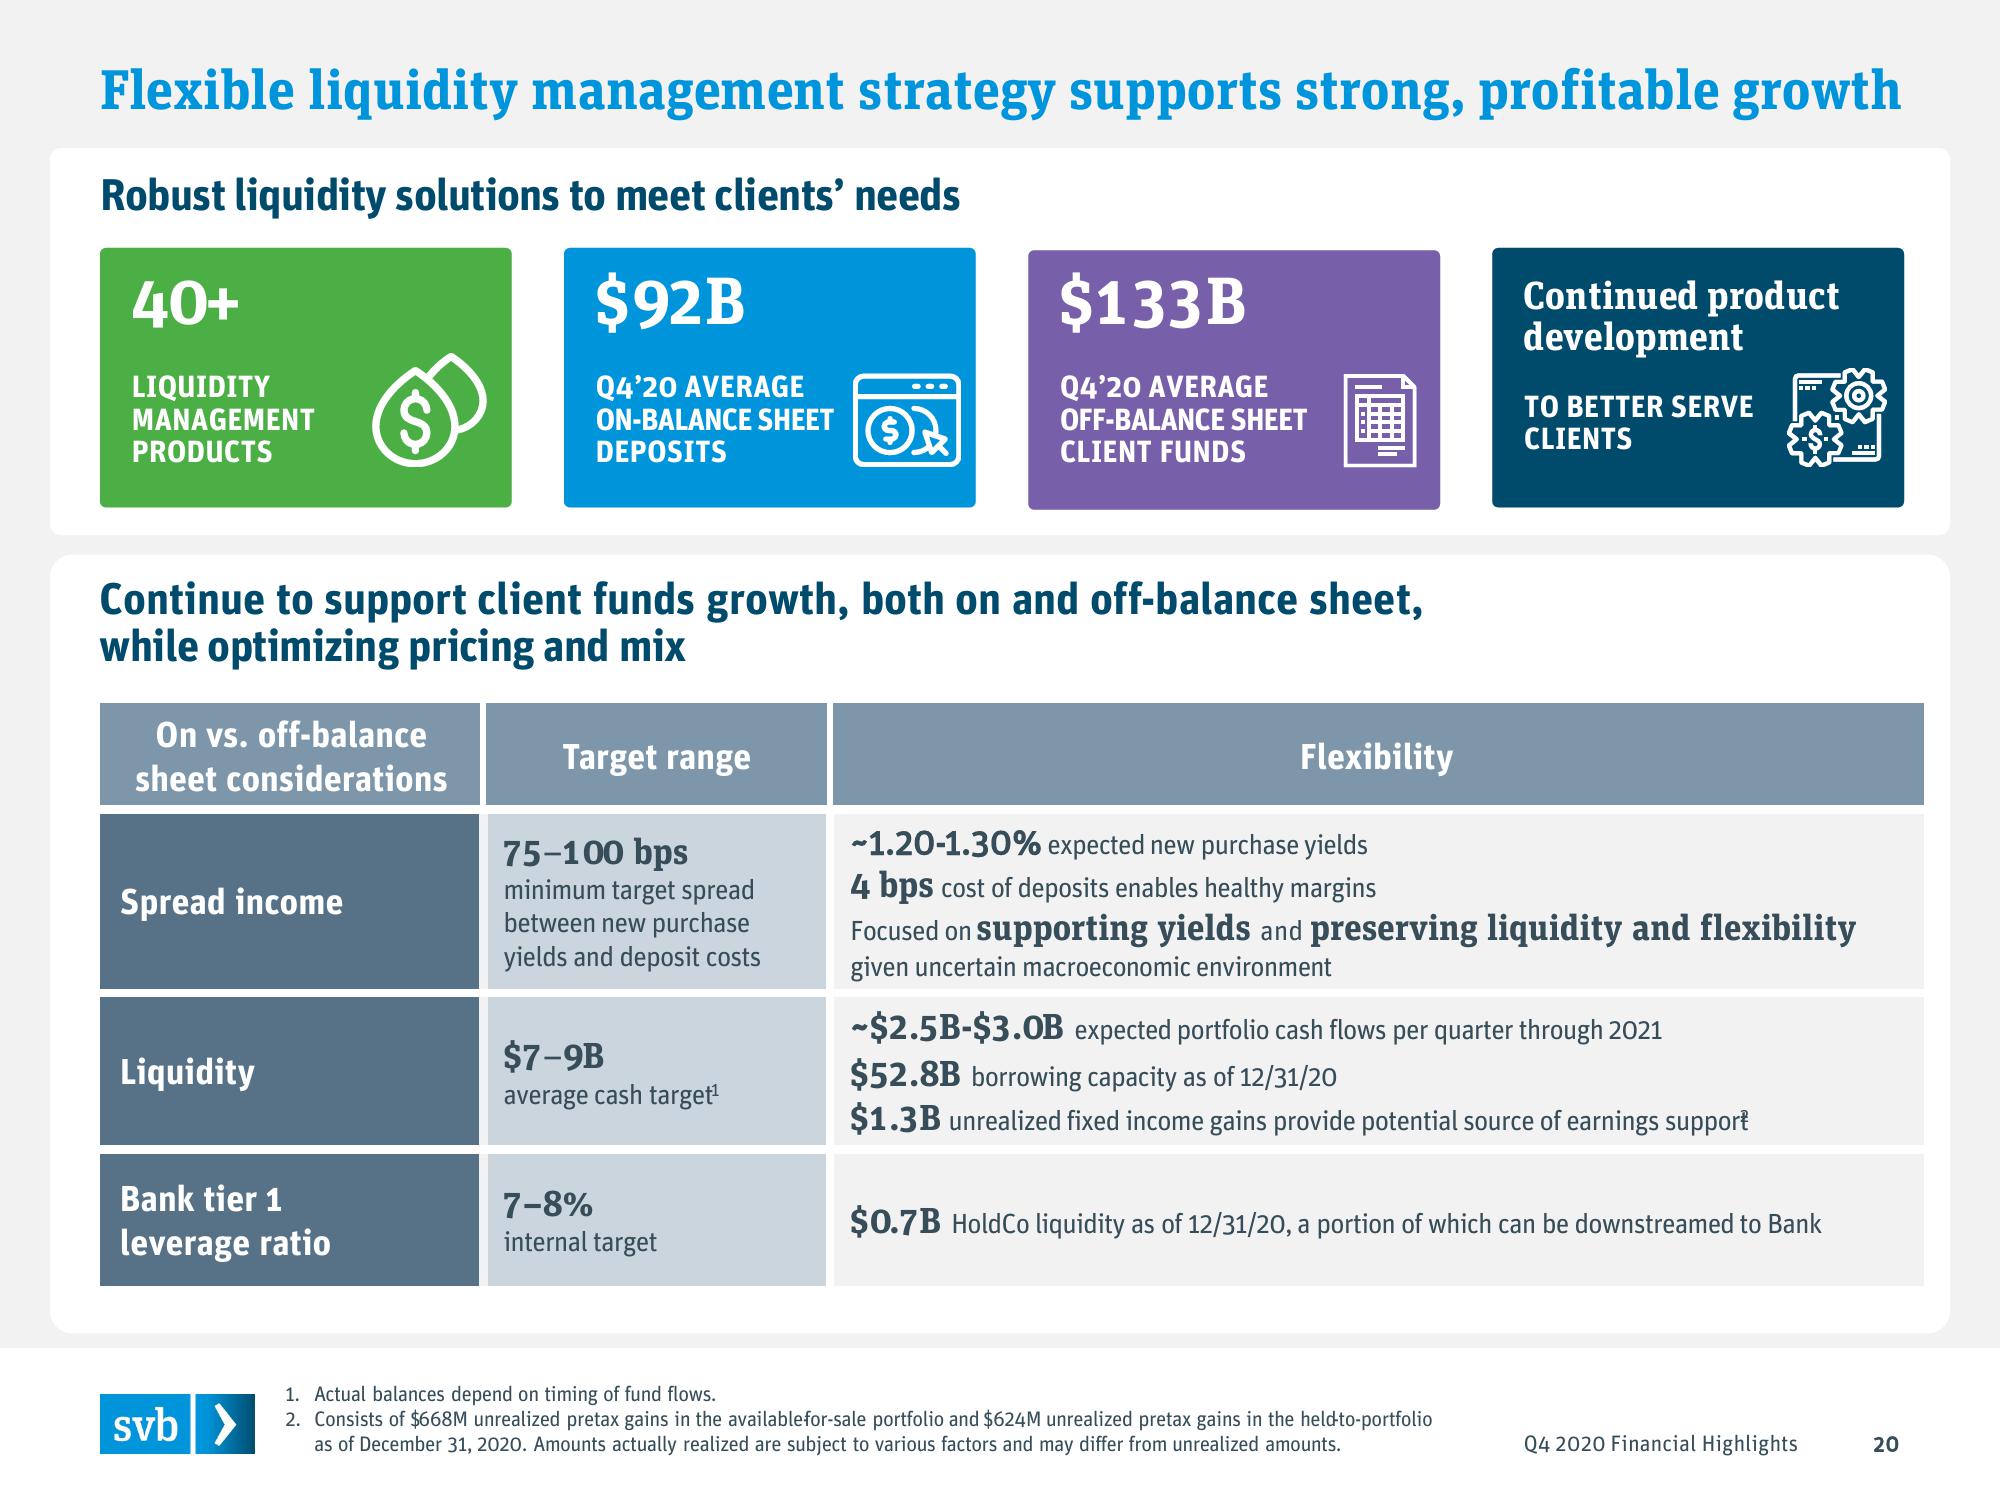
Flexible liquidity management strategy supports strong, profitable growth
Robust liquidity solutions to meet clients' needs
$92B
Q4'20 AVERAGE
ON-BALANCE SHEET
DEPOSITS
40+
LIQUIDITY
MANAGEMENT
PRODUCTS
Continue to support client funds growth, both on and off-balance sheet,
while optimizing pricing and mix
On vs. off-balance
sheet considerations
Spread income
Liquidity
Bank tier 1
leverage ratio
svb >
Target range
75-100 bps
minimum target spread
between new purchase
yields and deposit costs
$7-9B
average cash target¹
$133B
Q4'20 AVERAGE
OFF-BALANCE SHEET
CLIENT FUNDS
7-8%
internal target
Flexibility
Continued product
development
TO BETTER SERVE
CLIENTS
-1.20-1.30% expected new purchase yields
4 bps cost of deposits enables healthy margins
Focused on supporting yields and preserving liquidity and flexibility
given uncertain macroeconomic environment
-$2.5B-$3.0B expected portfolio cash flows per quarter through 2021
$52.8B borrowing capacity as of 12/31/20
$1.3B unrealized fixed income gains provide potential source of earnings support
1. Actual balances depend on timing of fund flows.
2. Consists of $668M unrealized pretax gains in the available for-sale portfolio and $624M unrealized pretax gains in the held-to-portfolio
as of December 31, 2020. Amounts actually realized are subject to various factors and may differ from unrealized amounts.
$0.7B HoldCo liquidity as of 12/31/20, a portion of which can be downstreamed to Bank
Q4 2020 Financial Highlights
20View entire presentation