LSE Investor Presentation Deck
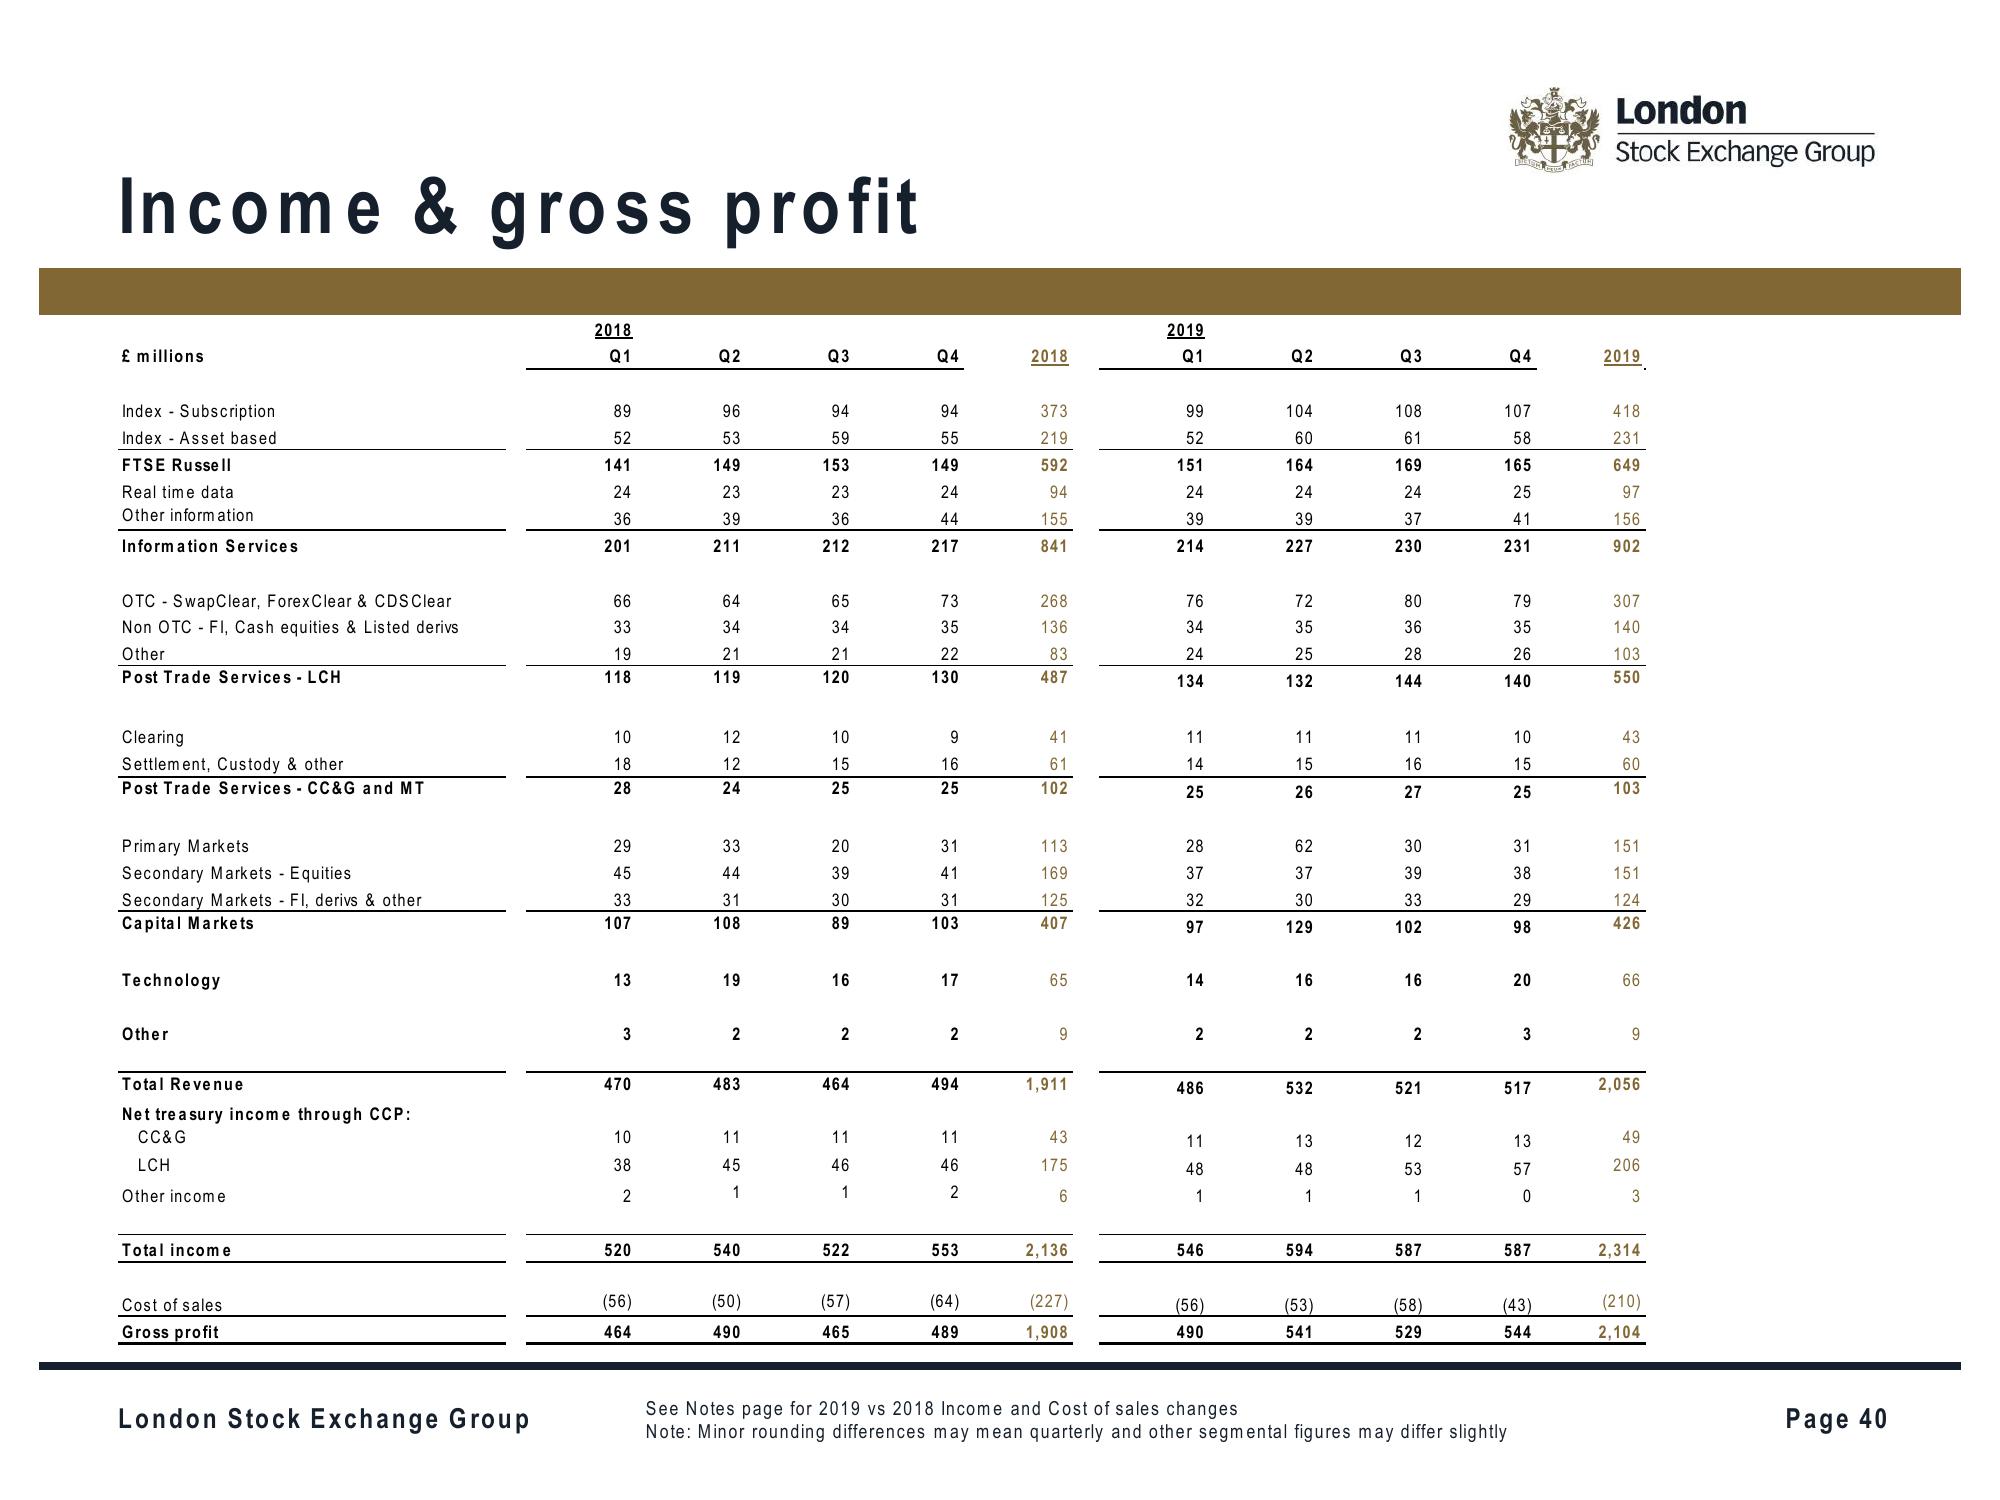
Income & gross profit
£ millions
Index Subscription
Index Asset based
FTSE Russell
Real time data
Other information
Information Services
OTC SwapClear, ForexClear & CDS Clear
Non OTC - FI, Cash equities & Listed derivs
Other
Post Trade Services - LCH
Clearing
Settlement, Custody & other
Post Trade Services CC&G and MT
Primary Markets
Secondary Markets - Equities
Secondary Markets FI, derivs & other
Capital Markets
Technology
Other
Total Revenue
Net treasury income through CCP:
CC&G
LCH
Other income
Total income
Cost of sales
Gross profit
London Stock Exchange Group
2018
Q1
89
52
141
24
36
201
66
33
19
118
10
18
28
29
45
33
107
13
3
470
10
38
2
520
(56)
464
Q2
96
53
149
23
39
211
64
34
21
119
12
12
24
33
44
31
108
19
2
483
11
45
1
540
(50)
490
Q3
94
59
153
23
36
212
65
34
21
120
10
15
25
20
39
30
89
16
2
464
11
46
1
522
(57)
465
Q4
94
55
149
24
44
217
73
35
22
130
9
16
25
31
41
31
103
17
2
494
11
46
2
553
(64)
489
2018
373
219
592
94
155
841
268
136
83
487
41
61
102
113
169
125
407
65
9
1,911
43
175
6
2,136
(227)
1,908
2019
Q1
99
52
151
24
39
214
76
34
24
134
11
14
25
28
37
32
97
14
2
486
11
48
1
546
(56)
490
Q2
104
60
164
24
39
227
72
35
25
132
11
15
26
62
37
30
129
16
2
532
13
48
1
594
(53)
541
Q3
108
61
169
24
37
230
80
36
28
144
11
16
27
30
39
33
102
16
2
521
12
53
1
587
(58)
529
Q4
107
58
165
25
41
231
79
35
26
140
10
15
25
31
38
29
98
20
See Notes page for 2019 vs 2018 Income and Cost of sales changes
Note: Minor rounding differences may mean quarterly and other segmental figures may differ slightly
3
517
13
57
0
587
(43)
544
London
Stock Exchange Group
2019
418
231
649
97
156
902
307
140
103
550
43
60
103
151
151
124
426
66
9
2,056
49
206
3
2,314
(210)
2,104
Page 40View entire presentation