Paysafe Results Presentation Deck
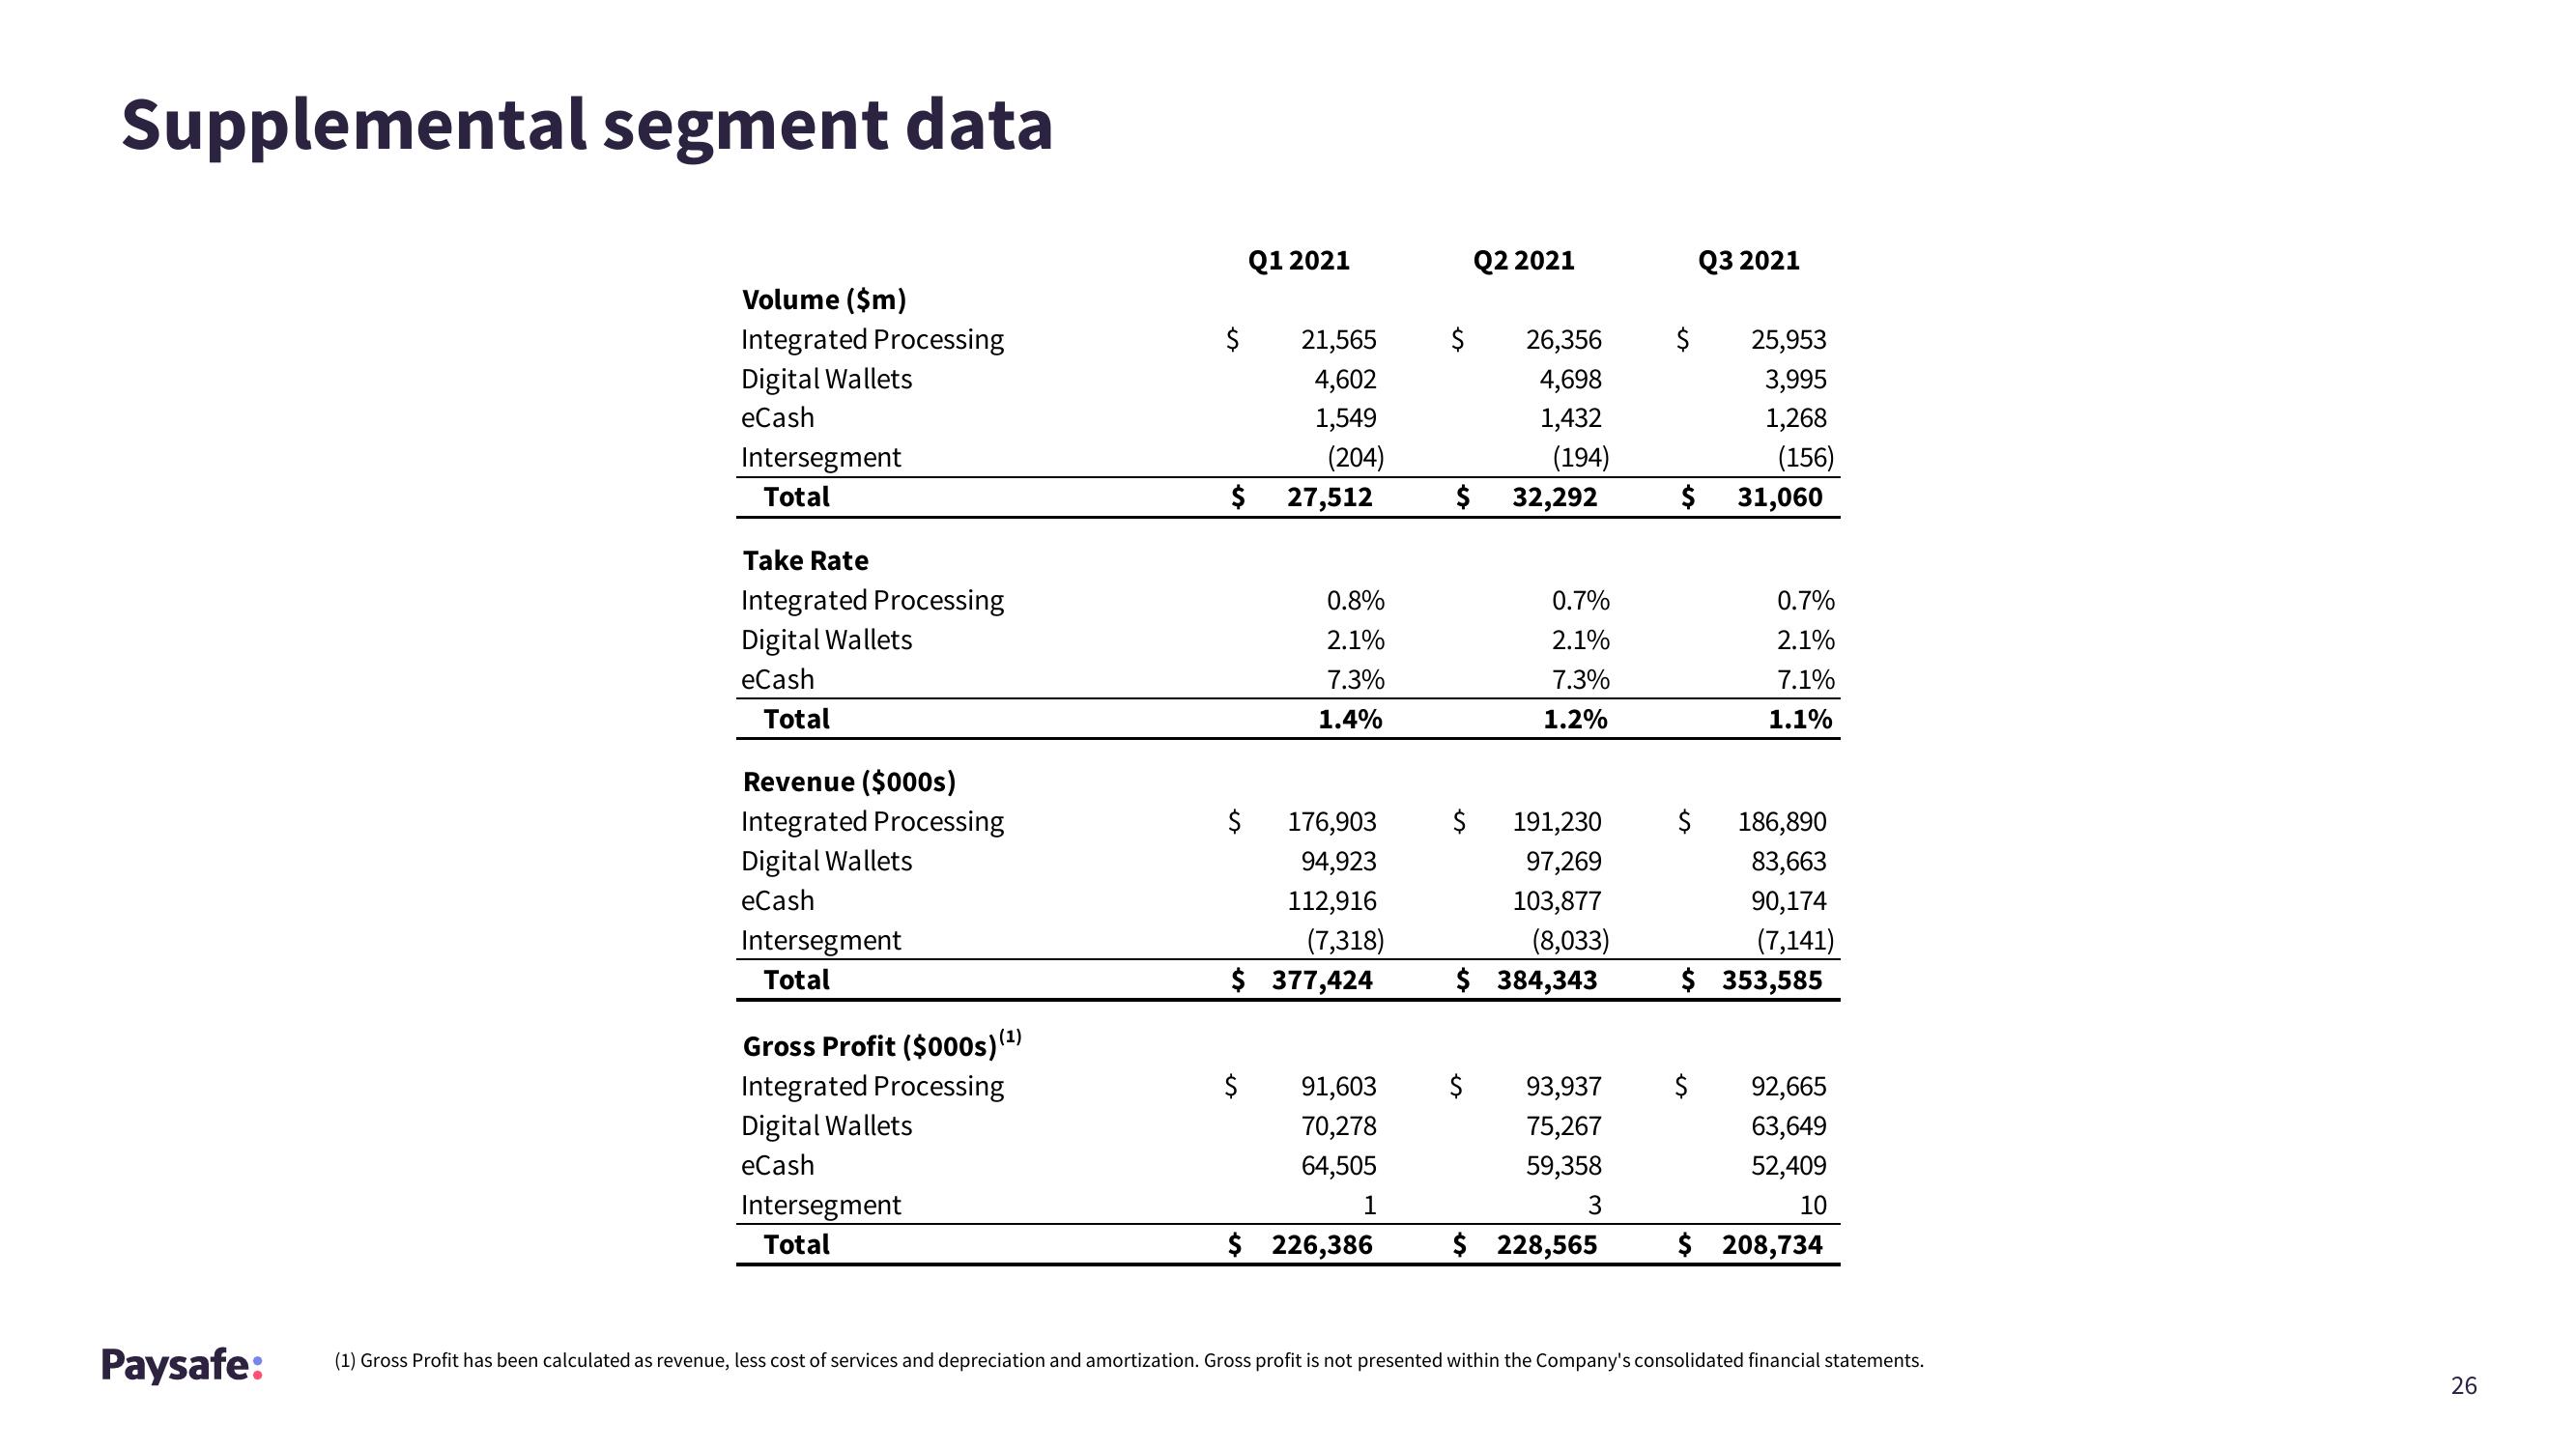
Supplemental segment data
Paysafe:
Volume ($m)
Integrated Processing
Digital Wallets
eCash
Intersegment
Total
Take Rate
Integrated Processing
Digital Wallets
eCash
Total
Revenue ($000s)
Integrated Processing
Digital Wallets
eCash
Intersegment
Total
Gross Profit ($000s) (¹)
Integrated Processing
Digital Wallets
eCash
Intersegment
Total
$
$
Q1 2021
(204)
$ 27,512
21,565 $
4,602
1,549
$
0.8%
2.1%
7.3%
1.4%
176,903
94,923
112,916
(7,318)
$ 377,424
91,603
70,278
64,505
1
$ 226,386
Q2 2021
26,356
4,698
1,432
(194)
$ 32,292
0.7%
2.1%
7.3%
1.2%
$ 191,230
97,269
103,877
(8,033)
$ 384,343
$ 93,937
75,267
59,358
3
$ 228,565
$
25,953
3,995
1,268
(156)
$ 31,060
$
Q3 2021
$
0.7%
2.1%
7.1%
1.1%
186,890
83,663
90,174
(7,141)
$ 353,585
92,665
63,649
52,409
10
$ 208,734
(1) Gross Profit has been calculated as revenue, less cost of services and depreciation and amortization. Gross profit is not presented within the Company's consolidated financial statements.
26View entire presentation