OSP Value Fund IV LP Q4 2022
OSP
22%
20%
18%
16%
14%
12%
10%
8%
6%
4%
2%
2.8
2.5
2.2
1.9
1.6
1.3
1.0
0.7
0.4
0.1
- W. Avg.
- W. Avg.
President
House
Senate
Fed Chair
Treasury
FDIC Chair
2012-1H
2012-1H
O
2012-2H
2012-2H
G
Geithner
2013-1H
2013-1H
Bernanke
Reid
2013-2H
2013-2H
2014-1H
Boehner
2014-1H
Obama
2014-2H
2014-2H
Lew
2015-1H
2015-1H
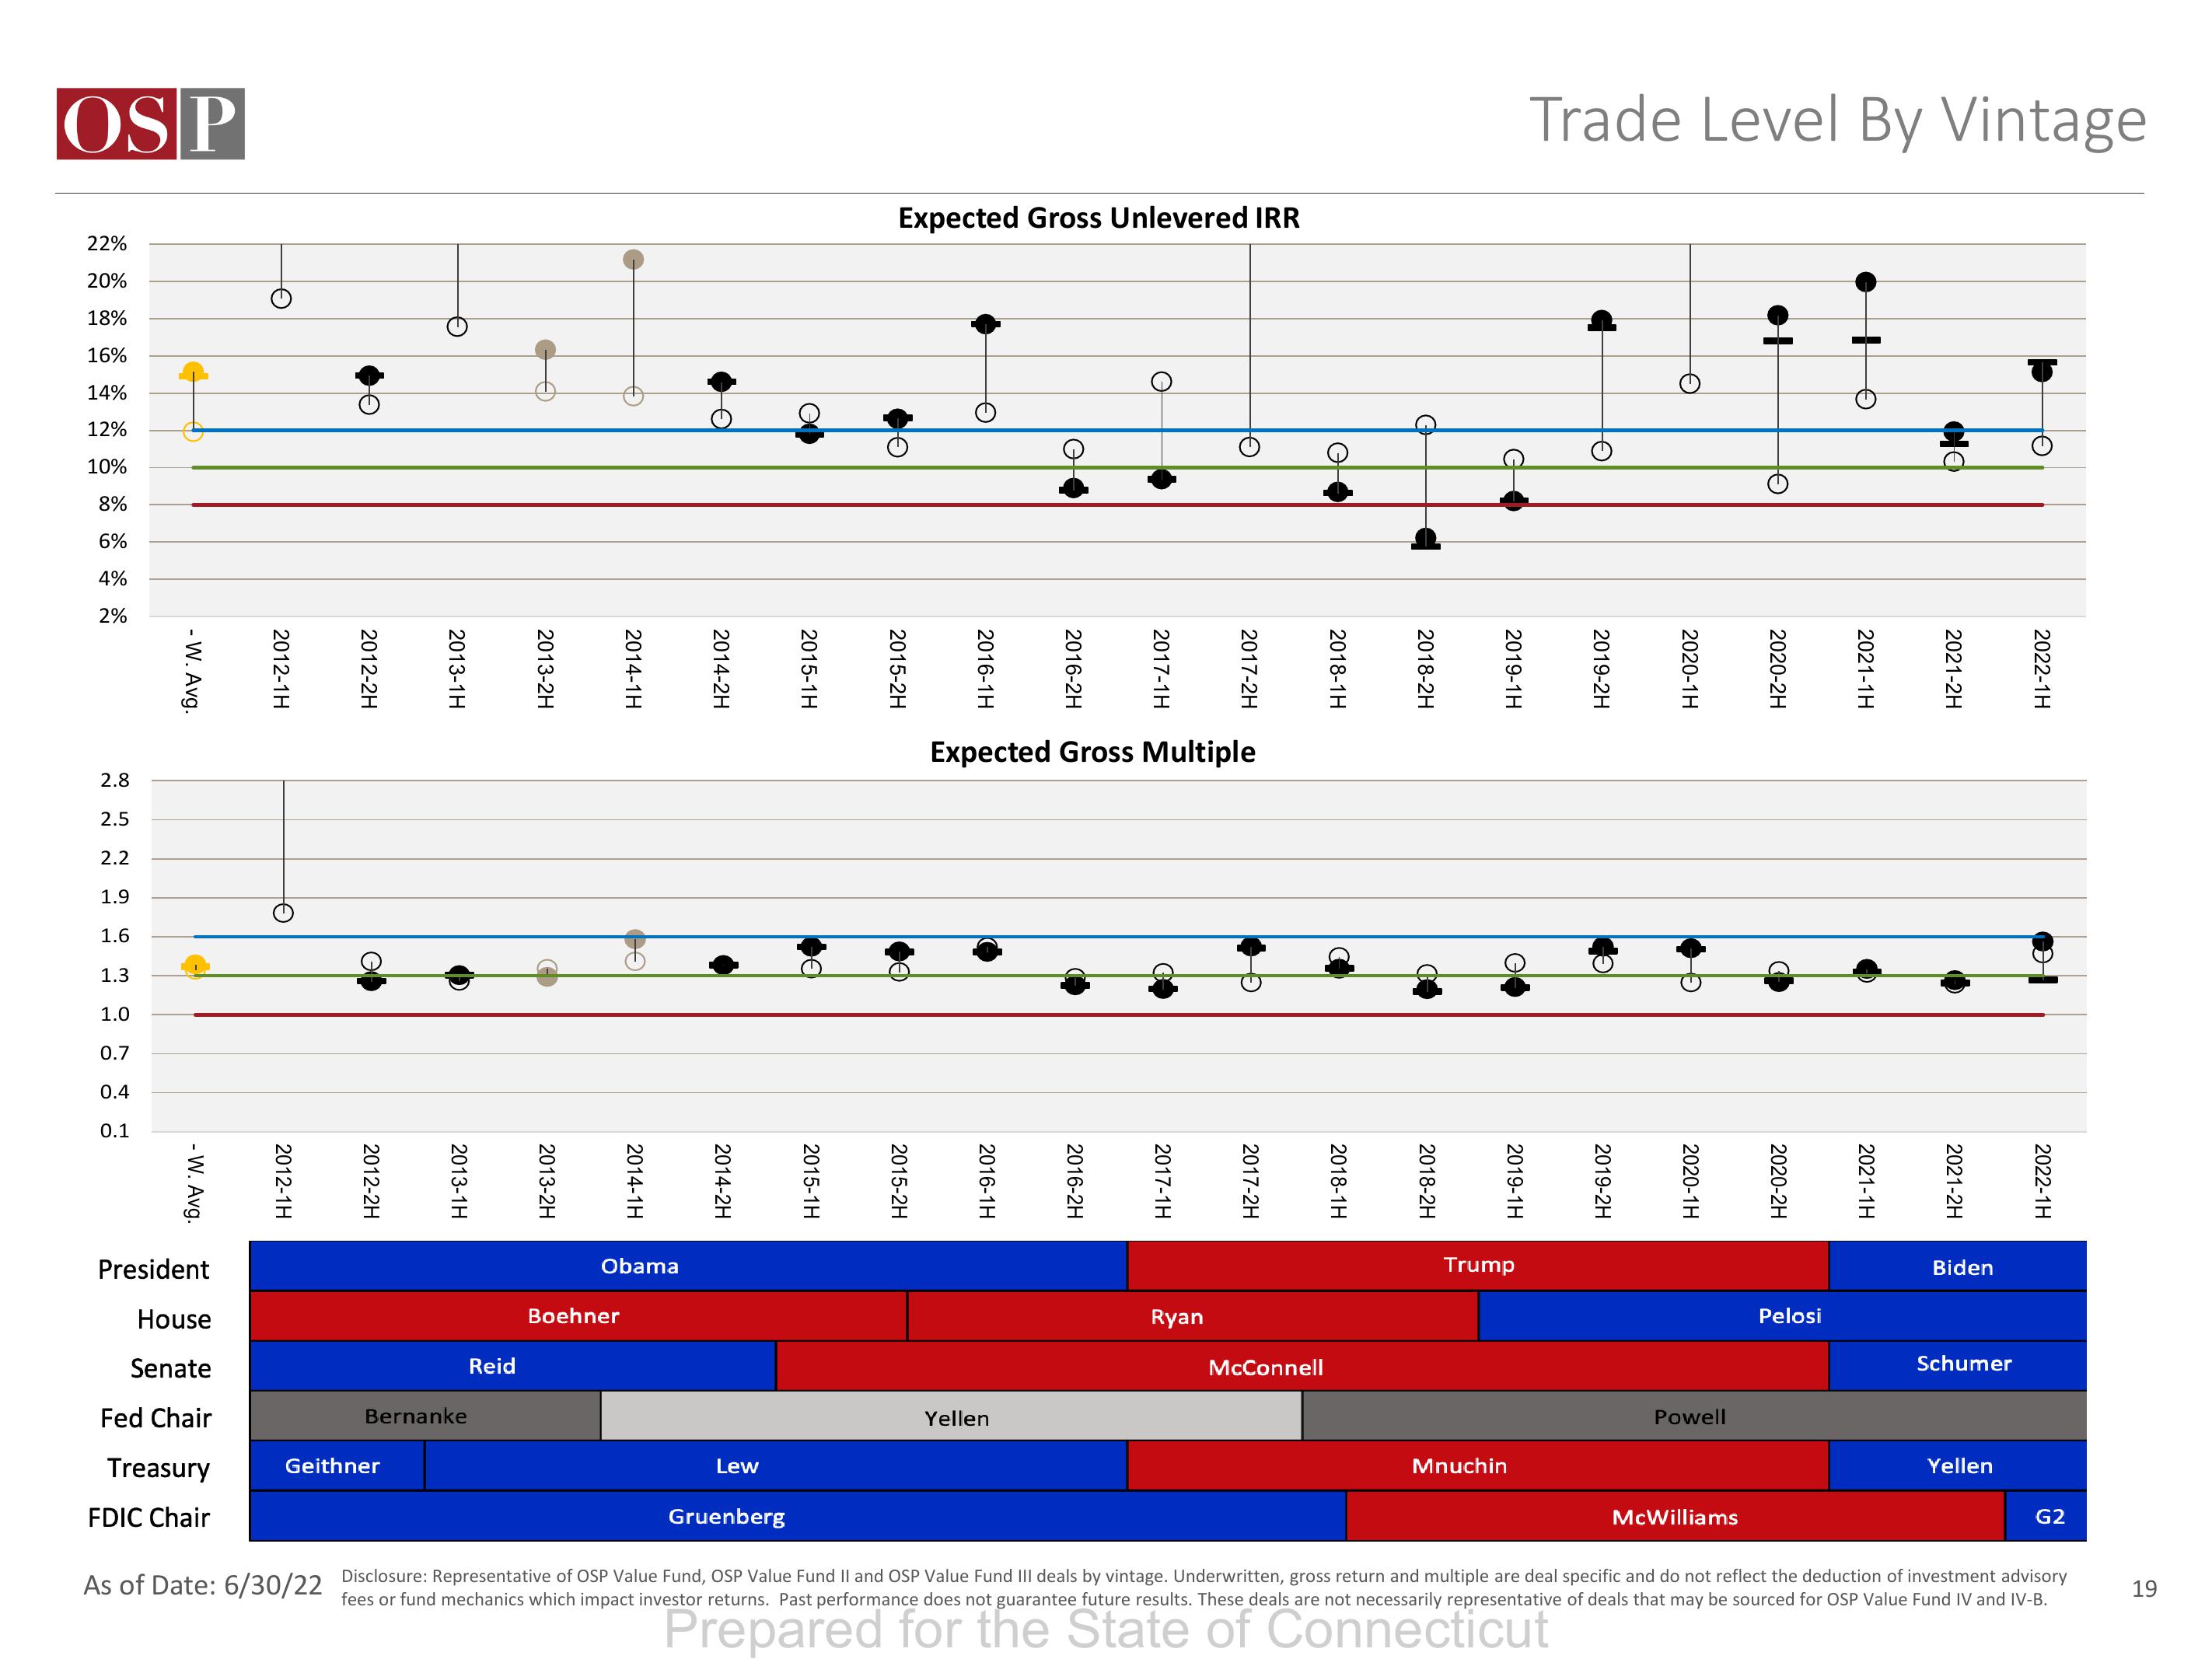
Expected Gross Unlevered IRR
2015-2H
2015-2H
2016-1H
2016-1H
2016-2H
Yellen
Expected Gross Multiple
2017-1H
2016-2H
2017-1H
2017-2H
Ryan
2017-2H
McConnell
2018-1H
2018-1H
2018-2H
2018-2H
2019-1H
2019-1H
Trump
Mnuchin
Trade Level By Vintage
2019-2H
2019-2H
2020-1H
2020-1H
Powell
McWilliams
2020-2H
2020-2H
Pelosi
2021-1H
2021-1H
2021-2H
2021-2H
Biden
Schumer
Yellen
2022-1H
2022-1H
Gruenberg
As of Date: 6/30/22 Disclosure: Representative of OSP Value Fund, OSP Value Fund II and OSP Value Fund III deals by vintage. Underwritten, gross return and multiple are deal specific and do not reflect the deduction of investment advisory
fees or fund mechanics which impact investor returns. Past performance does not guarantee future results. These deals are not necessarily representative of deals that may be sourced for OSP Value Fund IV and IV-B.
Prepared for the State of Connecticut
G2
19View entire presentation