OppFi Results Presentation Deck
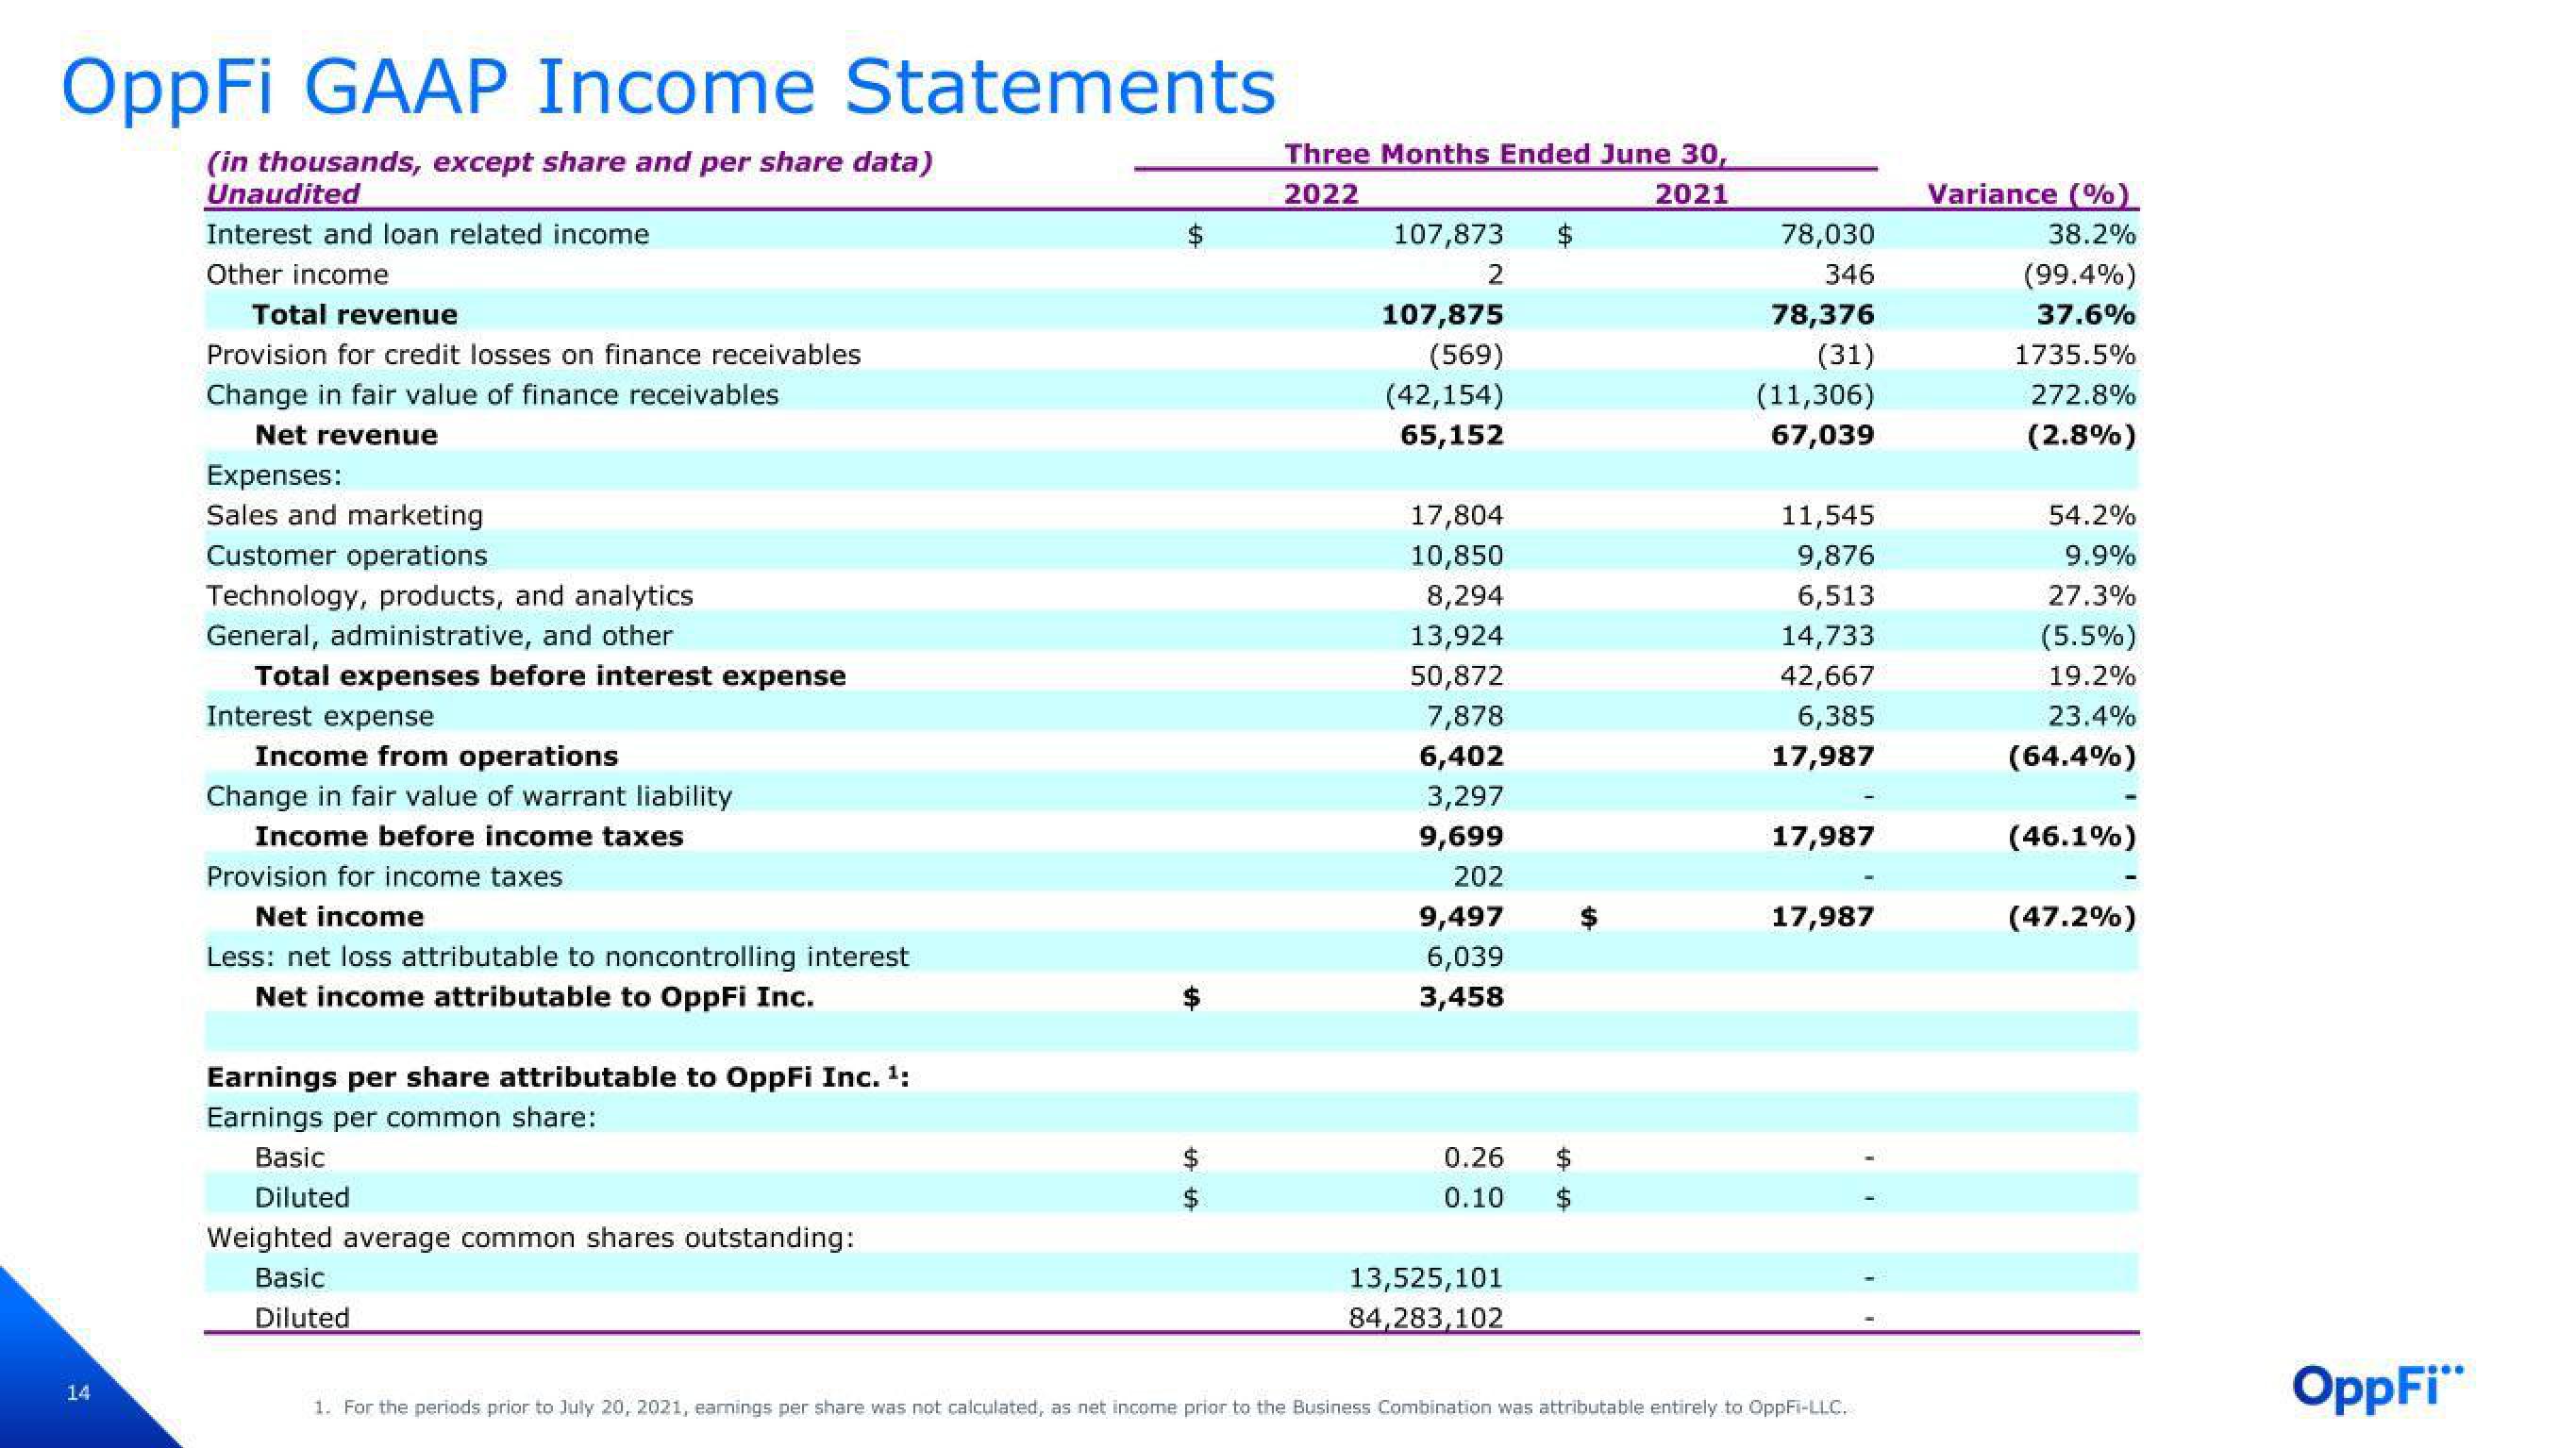
OppFi GAAP Income Statements
(in thousands, except share and per share data)
Unaudited
Interest and loan related income
Other income
14
Total revenue
Provision for credit losses on finance receivables
Change in fair value of finance receivables
Net revenue
Expenses:
Sales and marketing
Customer operations
Technology, products, and analytics
General, administrative, and other
Total expenses before interest expense
Interest expense
Income from operations
Change in fair value of warrant liability
Income before income taxes
Provision for income taxes
Net income
Less: net loss attributable to noncontrolling interest
Net income attributable to OppFi Inc.
Earnings per share attributable to OppFi Inc. ¹:
Earnings per common share:
Basic
Diluted
Weighted average common shares outstanding:
Basic
Diluted
+A
LA LA
Three Months Ended June 30,
2022
2021
107,873
2
107,875
(569)
(42,154)
65,152
17,804
10,850
8,294
13,924
50,872
7,878
6,402
3,297
9,699
202
9,497
6,039
3,458
0.26
0.10
13,525,101
84,283,102
78,030
346
78,376
(31)
(11,306)
67,039
11,545
9,876
6,513
14,733
42,667
6,385
17,987
17,987
17,987
1. For the periods prior to July 20, 2021, earnings per share was not calculated, as net income prior to the Business Combination was attributable entirely to OppFi-LLC.
Variance (%)
38.2%
(99.4%)
37.6%
1735.5%
272.8%
(2.8%)
54.2%
9.9%
27.3%
(5.5%)
19.2%
23.4%
(64.4%)
(46.1%)
(47.2%)
OppFi"View entire presentation