Nexters Results Presentation Deck
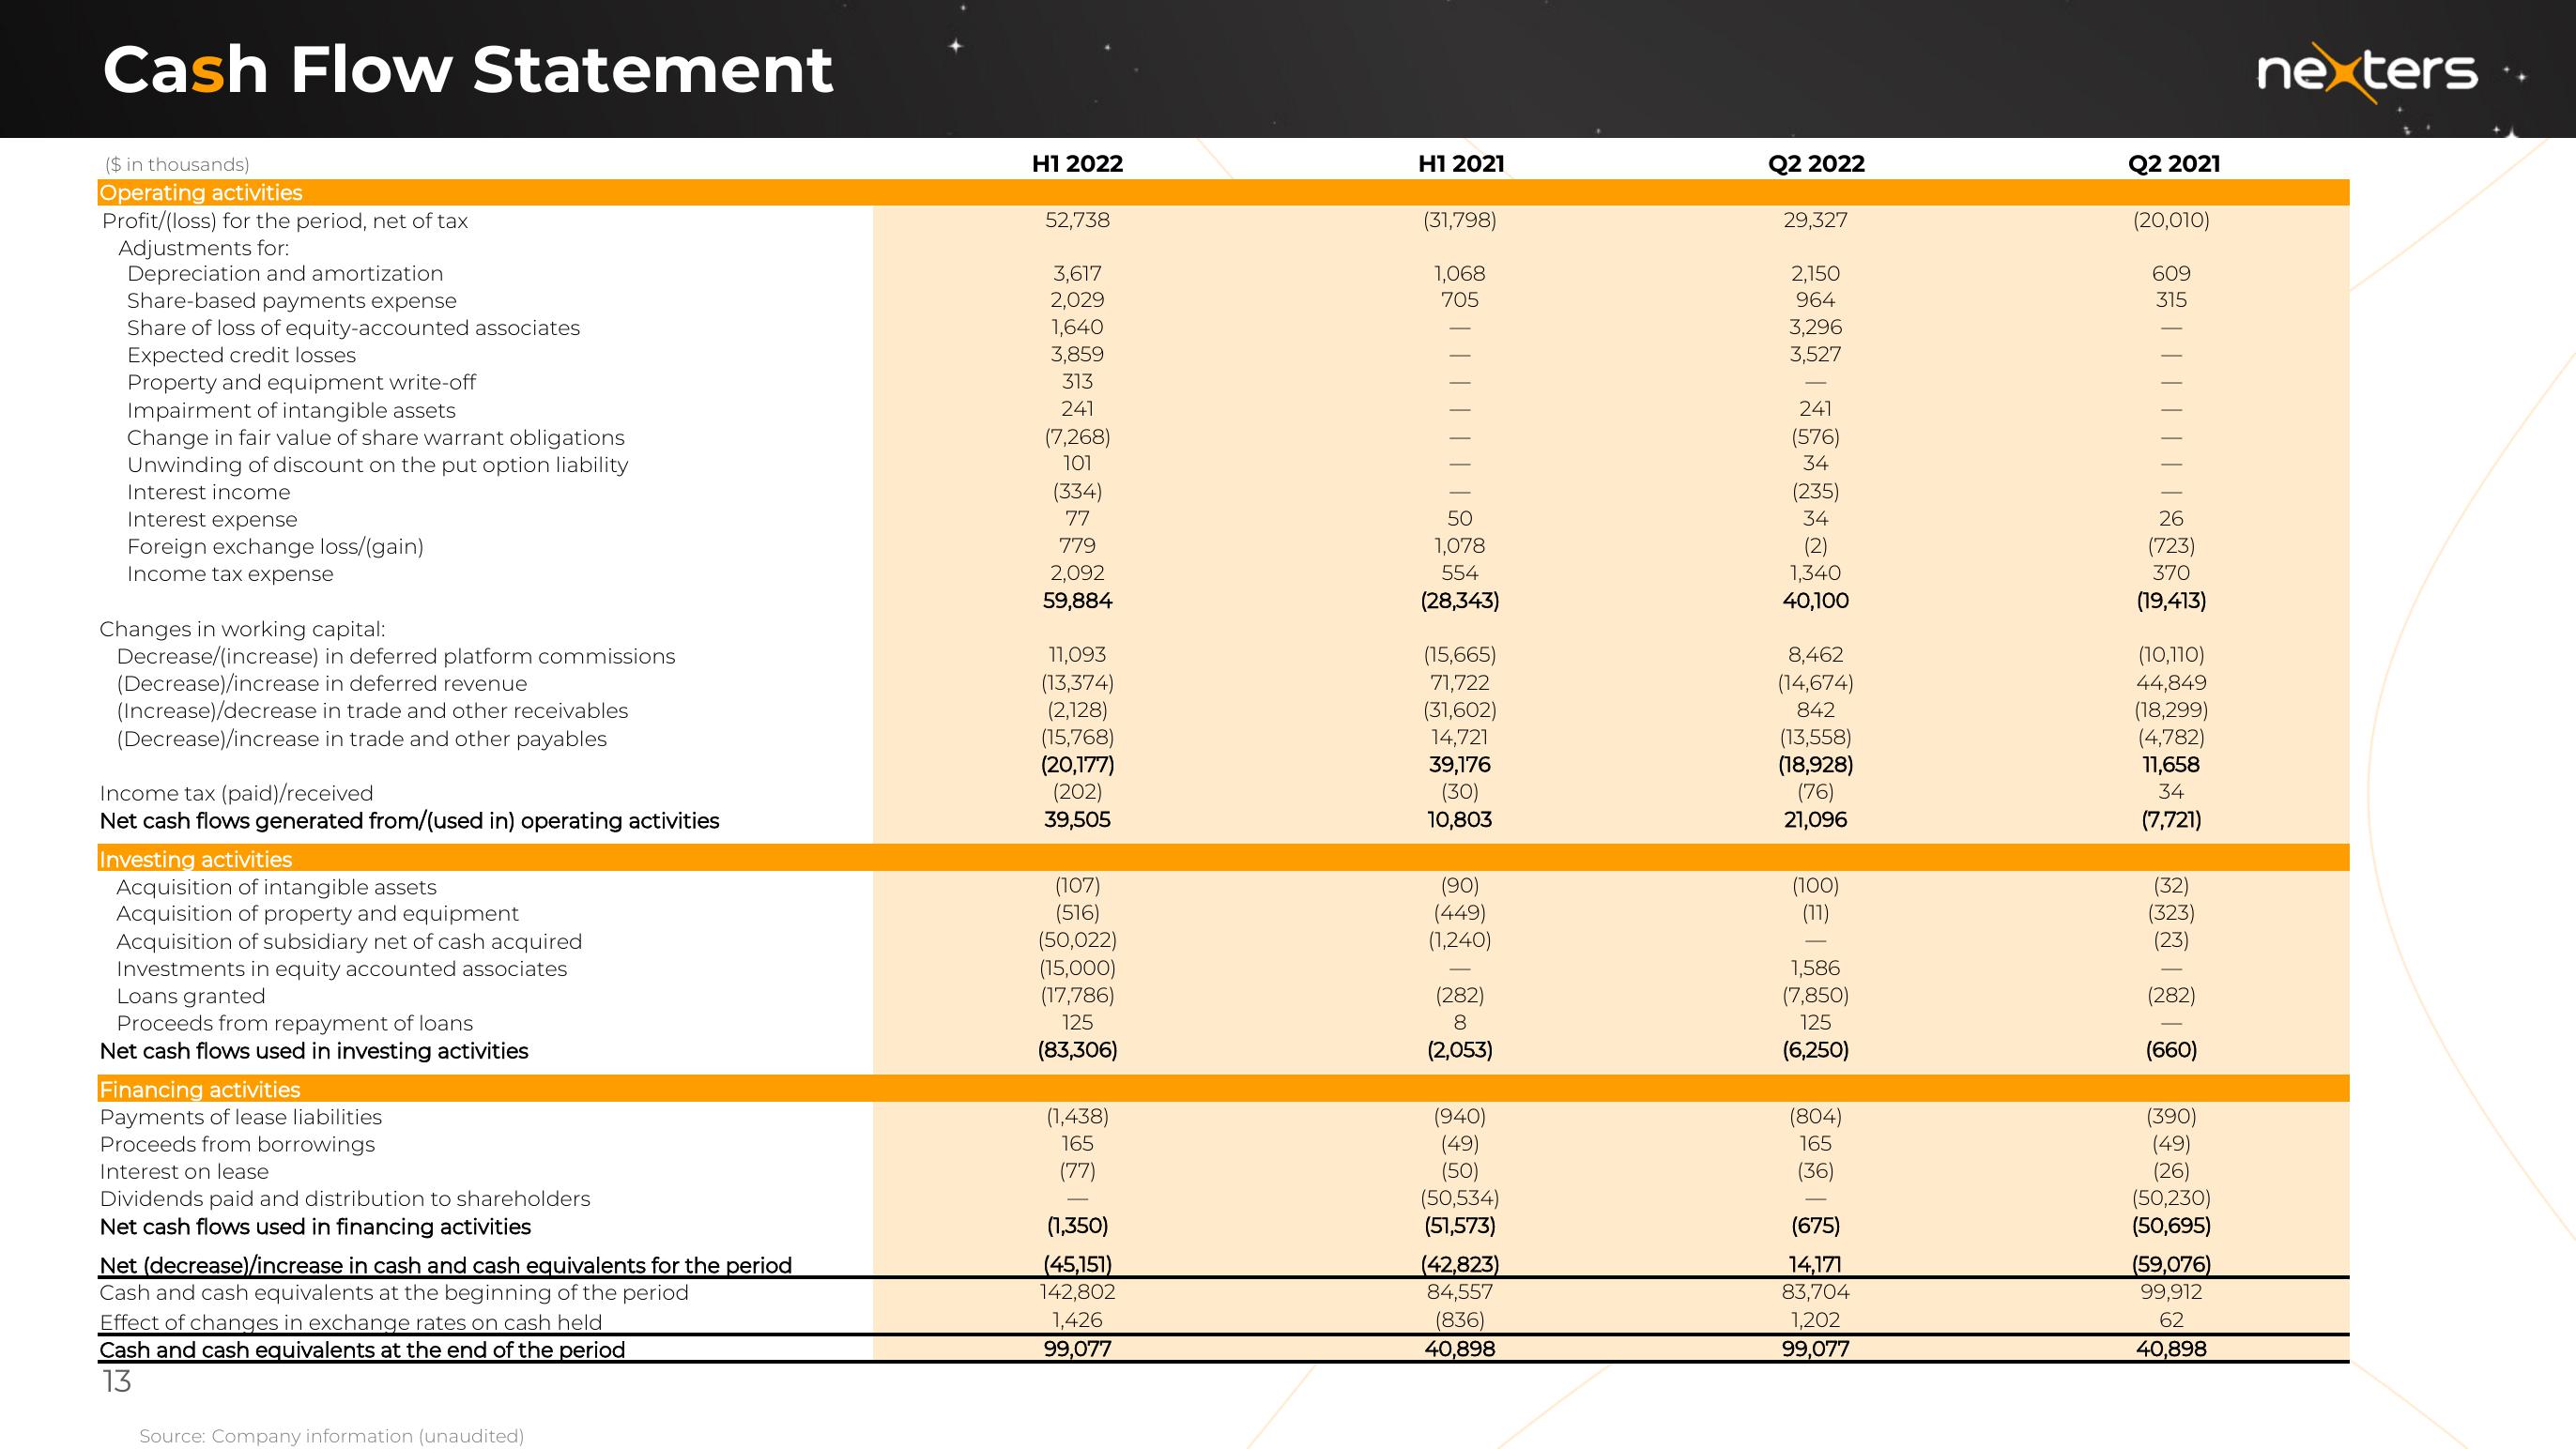
Cash Flow Statement
($ in thousands)
Operating activities
Profit/(loss) for the period, net of tax
Adjustments for:
Depreciation and amortization
Share-based payments expense
Share of loss of equity-accounted associates
Expected credit losses
Property and equipment write-off
Impairment of intangible assets
Change in fair value of share warrant obligations
Unwinding of discount on the put option liability
Interest income
Interest expense
Foreign exchange loss/(gain)
Income tax expense
Changes in working capital:
Decrease/(increase) in deferred platform commissions
(Decrease)/increase in deferred revenue
(Increase)/decrease in trade and other receivables
(Decrease)/increase in trade and other payables
Income tax (paid)/received
Net cash flows generated from/(used in) operating activities
Investing activities
Acquisition of intangible assets
Acquisition of property and equipment
Acquisition of subsidiary net of cash acquired
Investments in equity accounted associates
Loans granted
Proceeds from repayment of loans
Net cash flows used in investing activities
Financing activities
Payments of lease liabilities
Proceeds from borrowings
Interest on lease
Dividends paid and distribution to shareholders
Net cash flows used in financing activities
Net (decrease)/increase in cash and cash equivalents for the period
Cash and cash equivalents at the beginning of the period
Effect of changes in exchange rates on cash held
Cash and cash equivalents at the end of the period
13
Source: Company information (unaudited)
H1 2022
52,738
3,617
2,029
1,640
3,859
313
241
(7,268)
101
(334)
77
779
2,092
59,884
11,093
(13,374)
(2,128)
(15,768)
(20,177)
(202)
39,505
(107)
(516)
(50,022)
(15,000)
(17,786)
125
(83,306)
(1,438)
165
(77)
(1,350)
(45,151)
142,802
1,426
99,077
H12021
(31,798)
1,068
705
50
1,078
554
(28,343)
(15,665)
71,722
(31,602)
14,721
39,176
(30)
10,803
(90)
(449)
(1,240)
(282)
8
(2,053)
(940)
(49)
(50)
(50,534)
(51,573)
(42,823)
84,557
(836)
40,898
Q2 2022
29,327
2,150
964
3,296
3,527
241
(576)
34
(235)
34
(2)
1,340
40,100
8,462
(14,674)
842
(13,558)
(18,928)
(76)
21,096
(100)
(11)
1,586
(7,850)
125
(6,250)
(804)
165
(36)
(675)
14,171
83,704
1,202
99,077
Q2 2021
(20,010)
609
315
26
(723)
370
(19,413)
(10,110)
44,849
(18,299)
(4,782)
11,658
34
(7,721)
(32)
(323)
(23)
(282)
(660)
(390)
(49)
(26)
(50,230)
(50,695)
(59,076)
99,912
62
40,898
nextersView entire presentation