HashiCorp Investor Day Presentation Deck
36
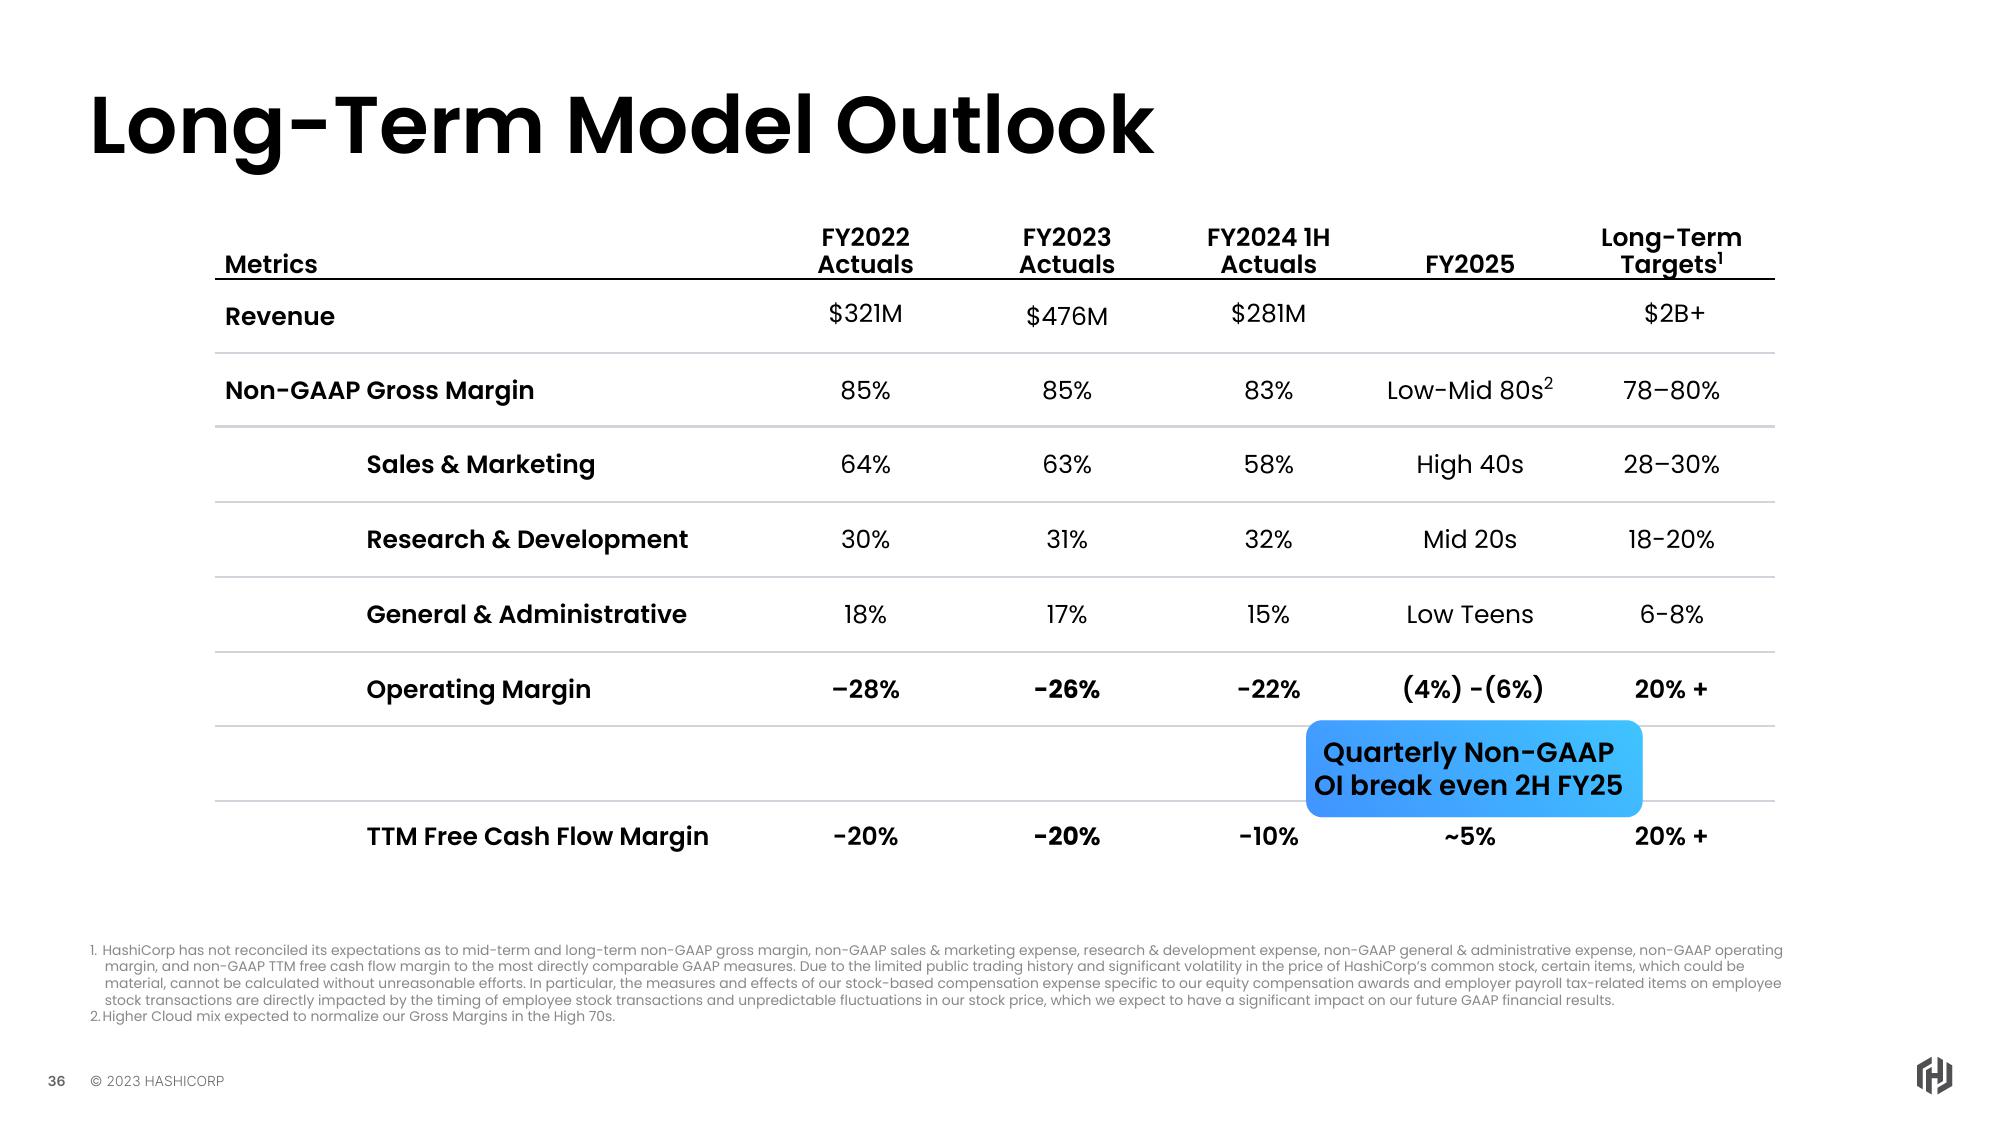
Long-Term Model Outlook
Metrics
Revenue
Non-GAAP Gross Margin
Sales & Marketing
© 2023 HASHICORP
Research & Development
General & Administrative
Operating Margin
TTM Free Cash Flow Margin
FY2022
Actuals
$321M
85%
64%
30%
18%
-28%
-20%
FY2023
Actuals
$476M
85%
63%
31%
17%
-26%
-20%
FY2024 1H
Actuals
$281M
83%
58%
32%
15%
-22%
-10%
FY2025
Low-Mid 80s²
High 40s
Mid 20s
Low Teens
Long-Term
Targets¹
$2B+
(4%) -(6%)
Quarterly Non-GAAP
Ol break even 2H FY25
~5%
78-80%
28-30%
18-20%
6-8%
20% +
20% +
1. HashiCorp has not reconciled its expectations as to mid-term and long-term non-GAAP gross margin, non-GAAP sales & marketing expense, research & development expense, non-GAAP general & administrative expense, non-GAAP operating
margin, and non-GAAP TTM free cash flow margin to the most directly comparable GAAP measures. Due to the limited public trading history and significant volatility in the price of HashiCorp's common stock, certain items, which could be
material, cannot be calculated without unreasonable efforts. In particular, the measures and effects of our stock-based compensation expense specific to our equity compensation awards and employer payroll tax-related items on employee
stock transactions are directly impacted by the timing of employee stock transactions and unpredictable fluctuations in our stock price, which we expect to have a significant impact on our future GAAP financial results.
2. Higher Cloud mix expected to normalize our Gross Margins in the High 70s.
HView entire presentation