JD Sports Results Presentation Deck
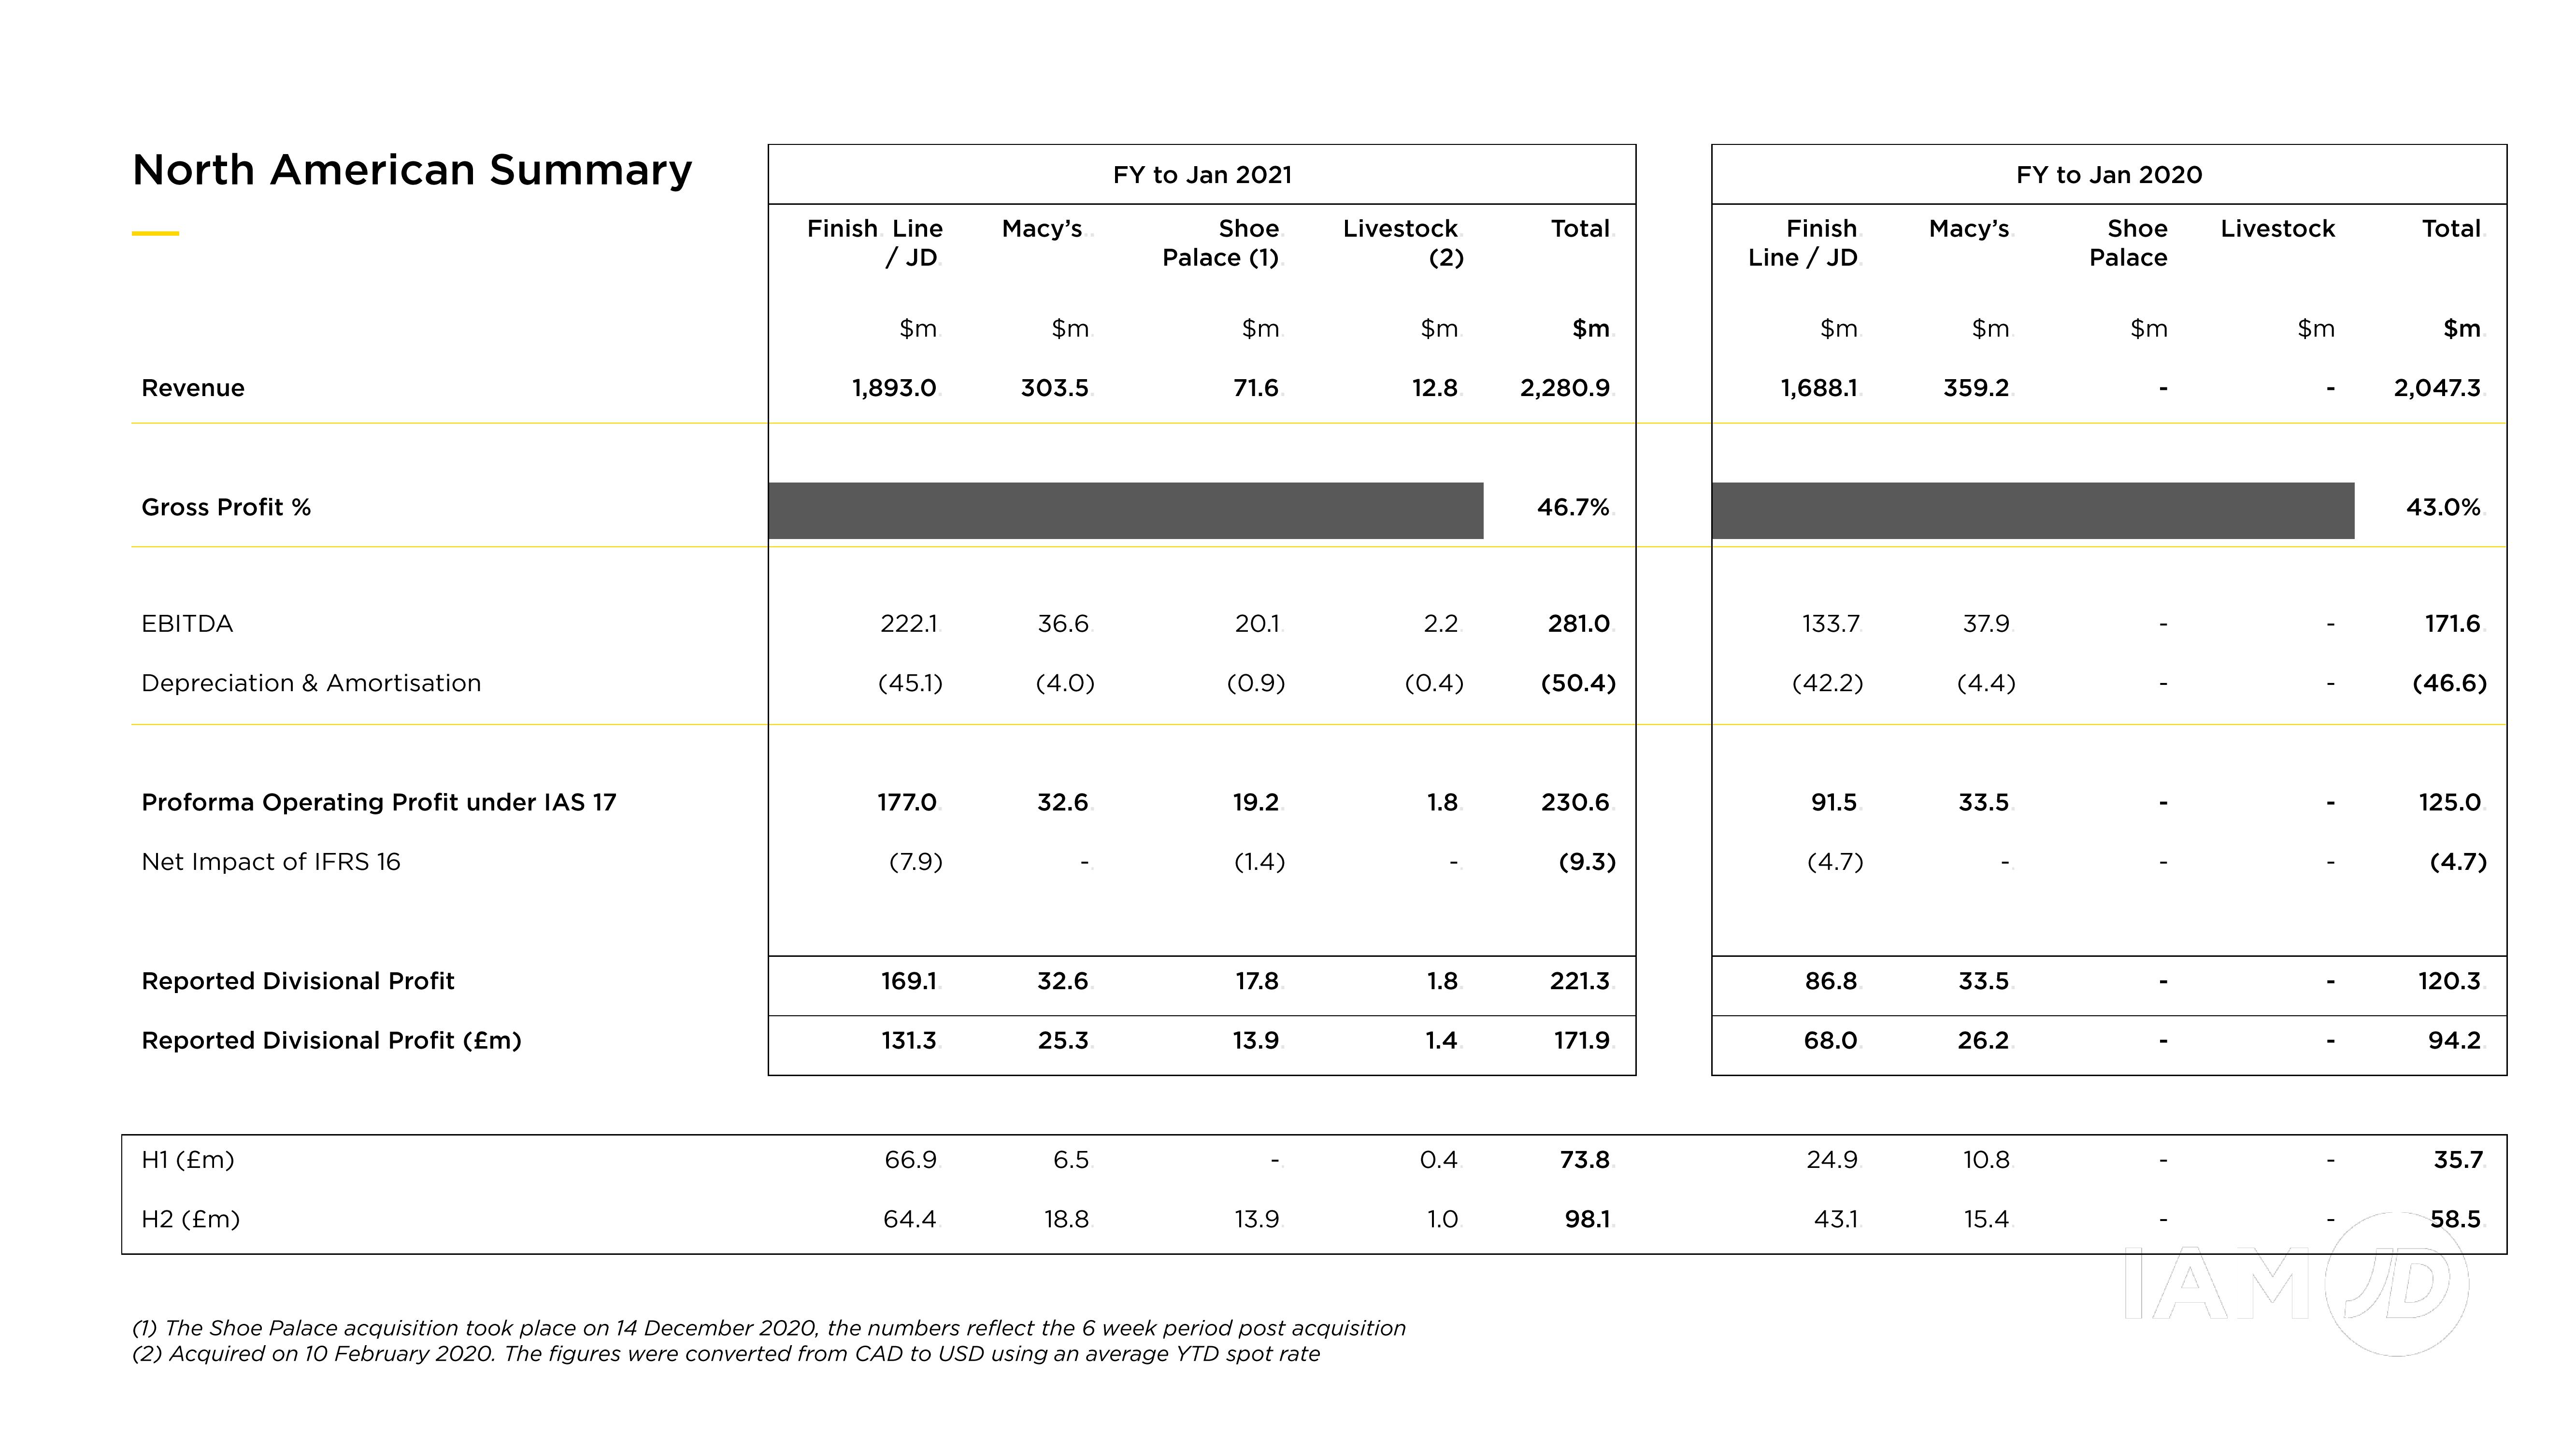
North American Summary
Revenue
Gross Profit %
EBITDA
Depreciation & Amortisation
Proforma Operating Profit under IAS 17
Net Impact of IFRS 16
Reported Divisional Profit
Reported Divisional Profit (£m)
H1 (Em)
H2 (£m)
Finish Line
/JD
$m
1,893.0
222.1.
(45.1)
177.0
(7.9)
169.1
131.3
66.9
64.4
Macy's
$m.
303.5
36.6
(4.0)
32.6
32.6
25.3
6.5
18.8
FY to Jan 2021
Shoe
Palace (1)
$m
71.6
20.1
(0.9)
19.2
(1.4)
17.8
13.9
13.9
Livestock
(2)
$m
(1) The Shoe Palace acquisition took place on 14 December 2020, the numbers reflect the 6 week period post acquisition
(2) Acquired on 10 February 2020. The figures were converted from CAD to USD using an average YTD spot rate
12.8
2.2
(0.4)
1.8
1.8
1.4
0.4
1.0
Total
$m
2,280.9
46.7%
281.0
(50.4)
230.6
(9.3)
221.3
171.9
73.8
98.1
Finish
Line / JD
$m
1,688.1
133.7
(42.2)
91.5
(4.7)
86.8
68.0
24.9
43.1
Macy's
$m.
359.2
37.9
(4.4)
33.5
33.5
26.2
10.8
FY to Jan 2020
15.4
Shoe Livestock
Palace
$m
$m
Total
$m
2,047.3
43.0%
171.6
(46.6)
125.0
(4.7)
120.3
94.2
35.7
58.5
MODYView entire presentation