GlobalFoundries Results Presentation Deck
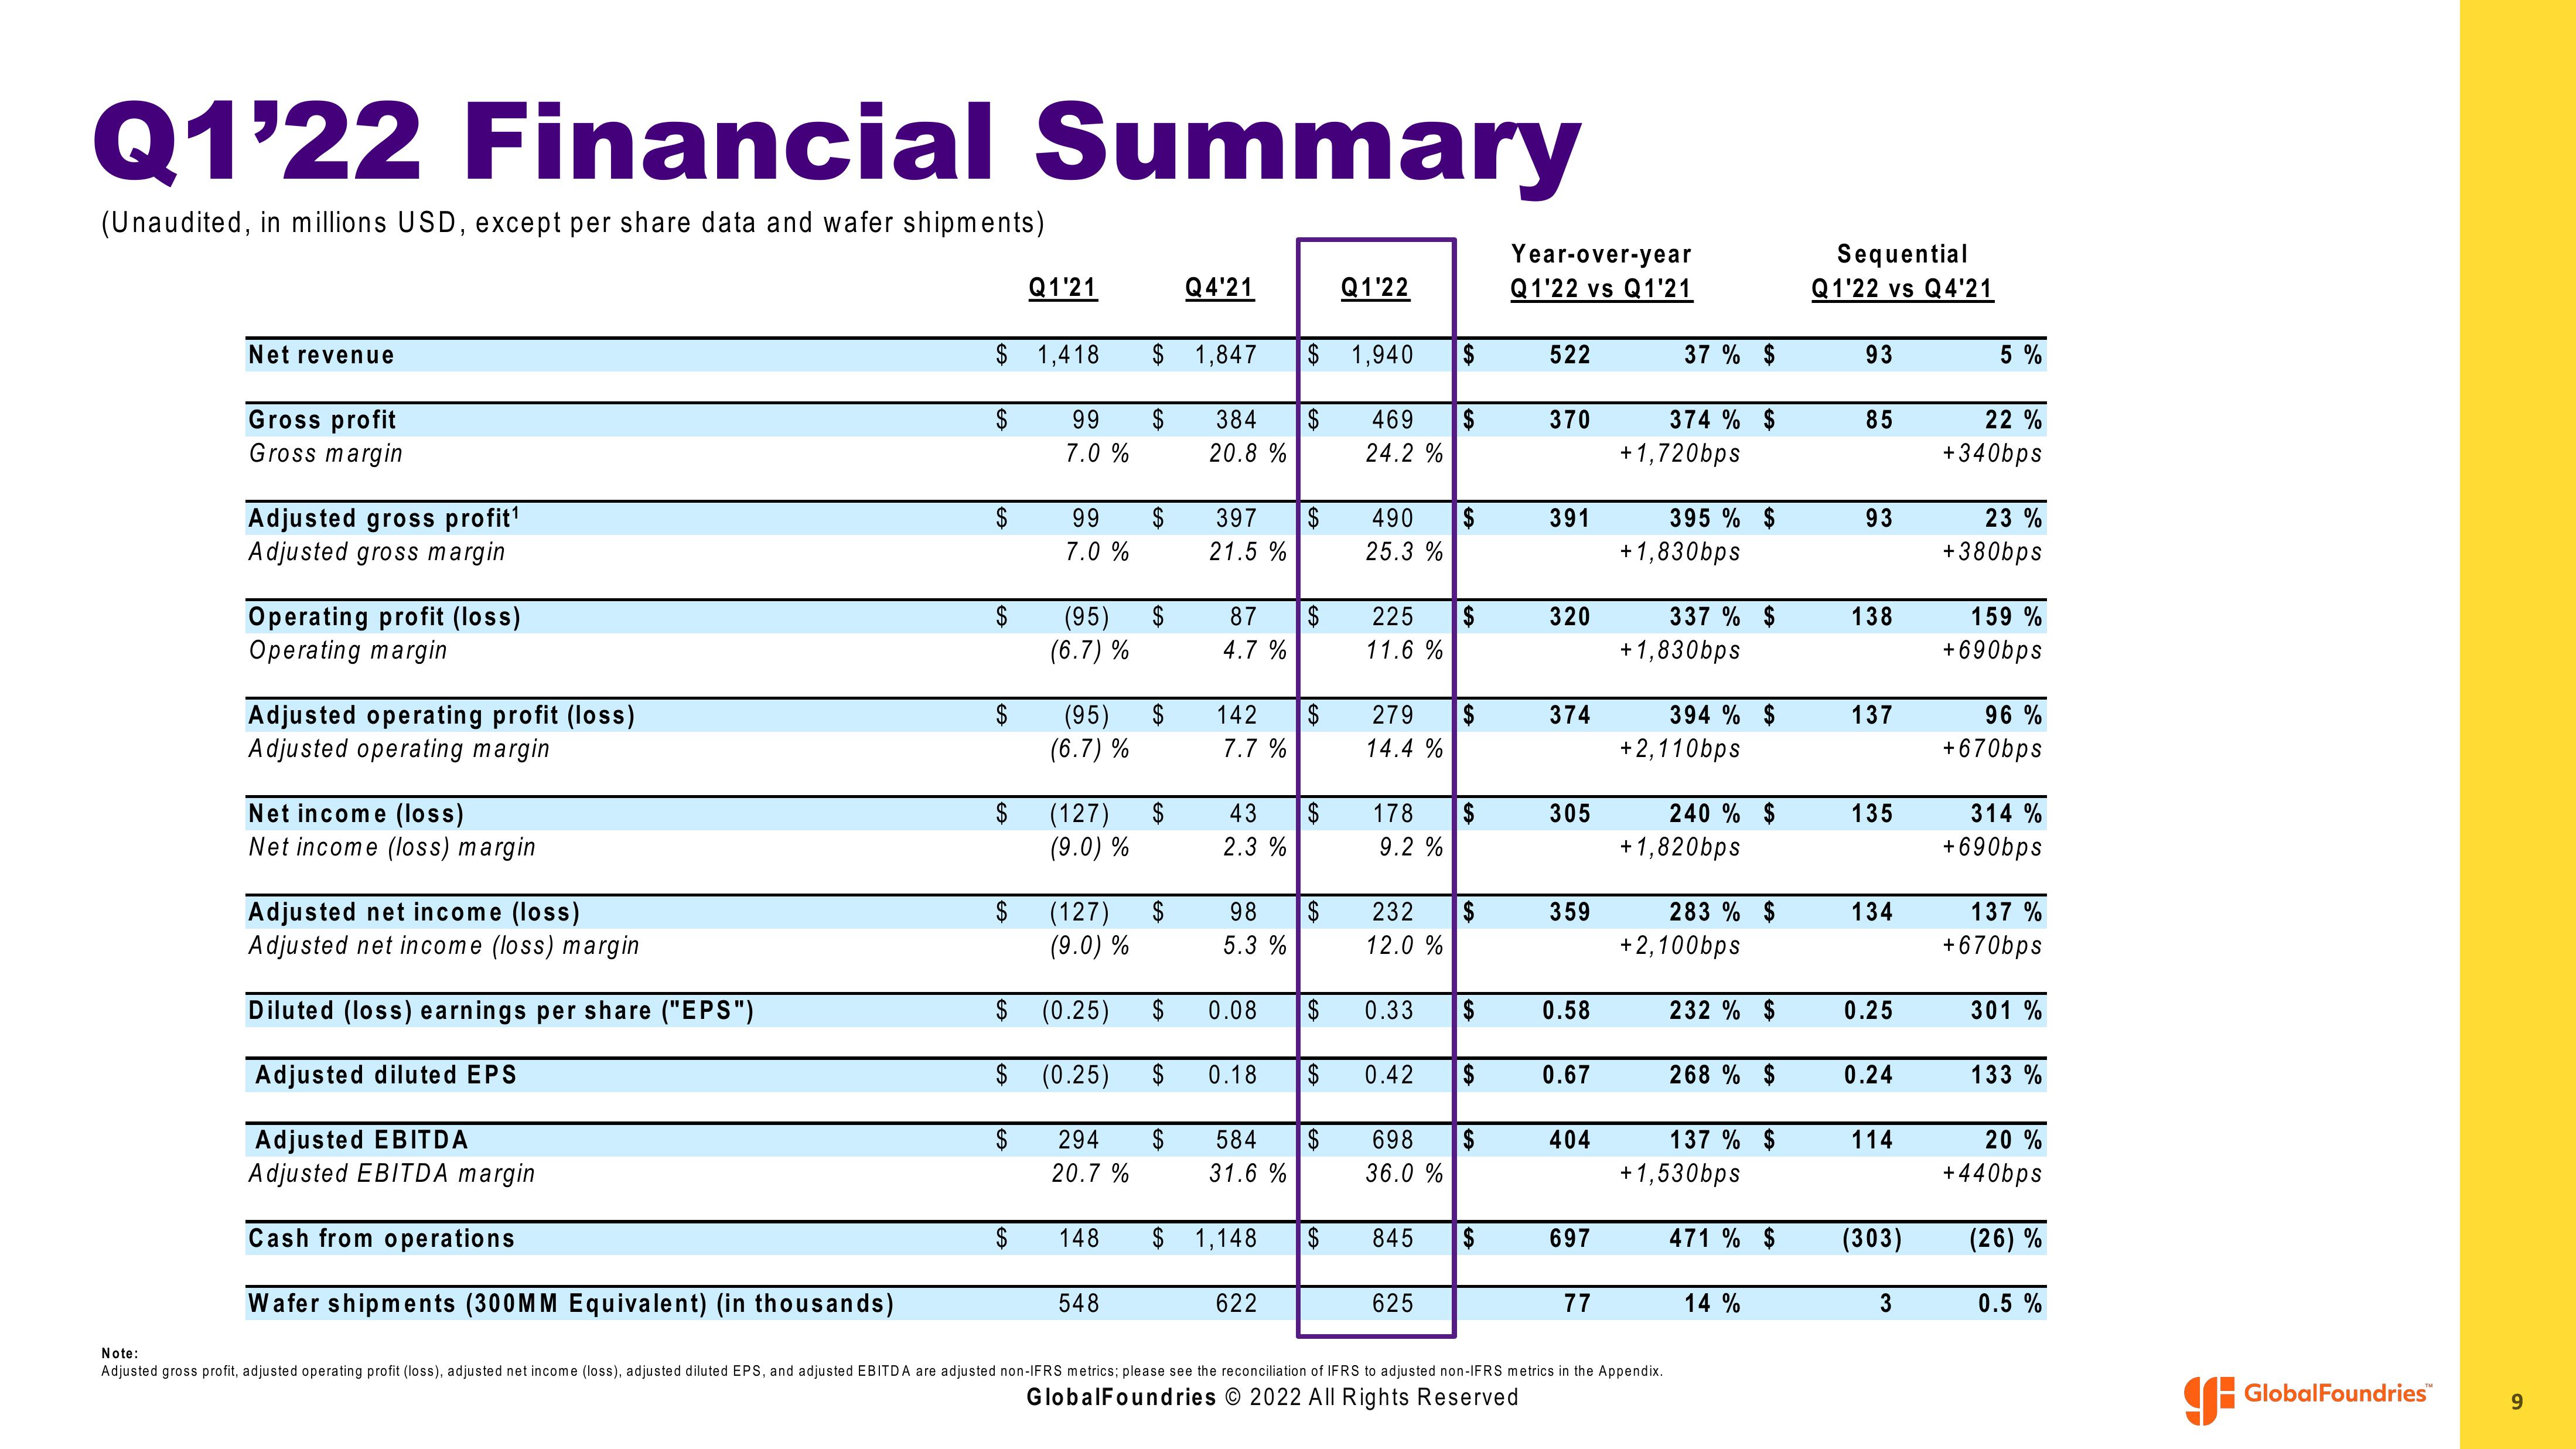
Q1'22 Financial Summary
(Unaudited, in millions USD, except per share data and wafer shipments)
Net revenue
Gross profit
Gross margin
Adjusted gross profit¹
Adjusted gross margin
Operating profit (loss)
Operating margin
Adjusted operating profit (loss)
Adjusted operating margin
Net income (loss)
Net income (loss) margin
$
$
$
$
$
$
$
$
$
$
Q1'21
$
1,418
99 $
7.0 %
99
7.0%
$ 1,847
(95) $
(6.7) %
$
(95) $
(6.7) %
(127) $
(9.0) %
(127) $
(9.0) %
(0.25) $
(0.25)
$
294
20.7%
148
548
Q4'21
$
384 $
20.8%
397 $
21.5 %
87 $
4.7 %
142 $
7.7 %
43
2.3%
$ 1,940 $
469 $
24.2%
98
5.3%
$
$
0.08 $
$ 1,148
0.18 $
622
584 $
31.6%
Q1'22
$
490
25.3%
225
11.6%
279
14.4%
Adjusted net income (loss)
Adjusted net income (loss) margin
Diluted (loss) earnings per share ("EPS")
Adjusted diluted EPS
Adjusted EBITDA
Adjusted EBITDA margin
Cash from operations
Wafer shipments (300MM Equivalent) (in thousands)
Note:
Adjusted gross profit, adjusted operating profit (loss), adjusted net income (loss), adjusted diluted EPS, and adjusted EBITDA are adjusted non-IFRS metrics; please see the reconciliation of IFRS to adjusted non-IFRS metrics in the Appendix.
GlobalFoundries © 2022 All Rights Reserved
232
12.0%
$
178 $
9.2 %
0.33
$
$
625
$
$
0.42 $
698 $
36.0 %
845 $
Year-over-year
Q1'22 vs Q1'21
522
370
391
320
374
305
359
0.58
0.67
404
697
77
37% $
374 % $
+1,720bps
395 % $
+1,830bps
337 % $
+1,830bps
394% $
+2,110bps
240 % $
+1,820bps
283 % $
+2,100bps
232 % $
268% $
137 % $
+1,530bps
471 % $
14%
Sequential
Q1'22 vs Q4'21
93
85
93
138
137
135
134
0.25
0.24
114
(303)
3
5%
22%
+340bps
23%
+380bps
159 %
+690bps
96%
+670bps
314%
+690bps
137 %
+670bps
301 %
133 %
20%
+440bps
(26) %
0.5%
GlobalFoundries
9View entire presentation