PV Modules: Bifacial technology
go PV
Introduction
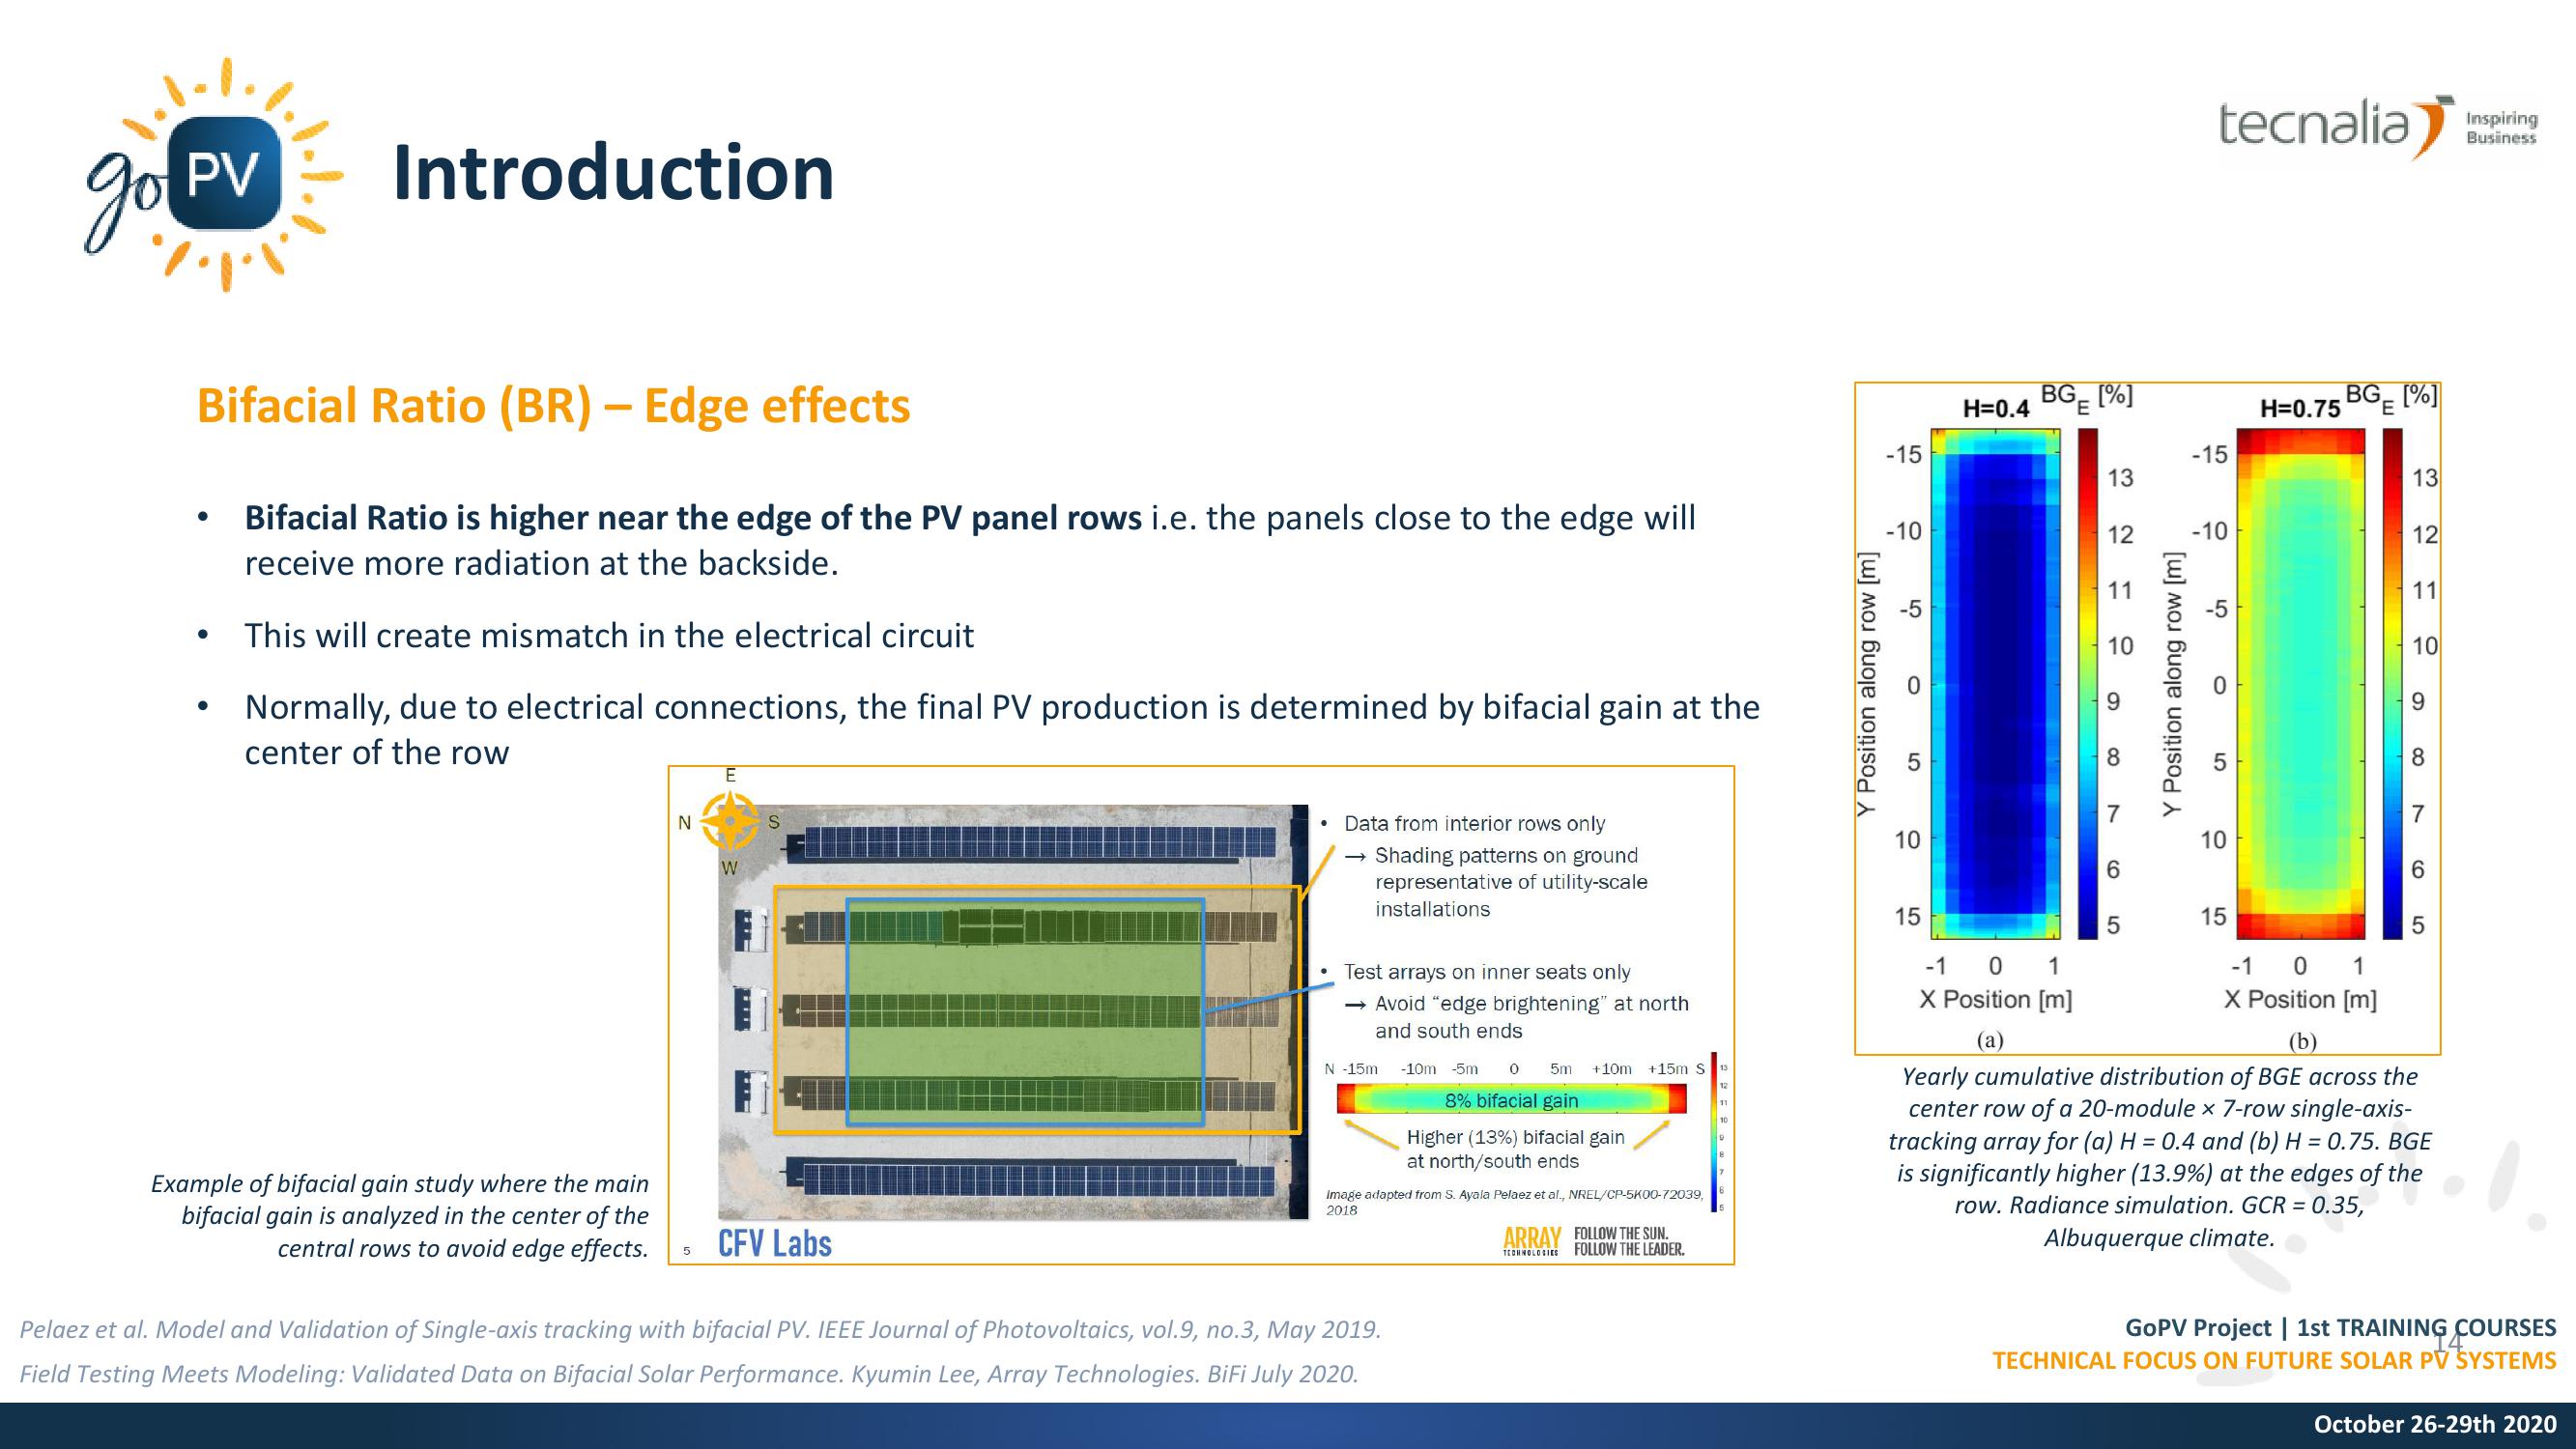
Bifacial Ratio (BR) - Edge effects
•
.
Bifacial Ratio is higher near the edge of the PV panel rows i.e. the panels close to the edge will
receive more radiation at the backside.
This will create mismatch in the electrical circuit
Normally, due to electrical connections, the final PV production is determined by bifacial gain at the
center of the row
Example of bifacial gain study where the main
bifacial gain is analyzed in the center of the
central rows to avoid edge effects.
E
N
W
5
CFV Labs
Data from interior rows only
→> Shading patterns on ground
representative of utility-scale
installations
Test arrays on inner seats only
→ Avoid "edge brightening" at north
and south ends
N -15m -10m -5m
0
5m +10m +15m S
8% bifacial gain
Higher (13%) bifacial gain
at north/south ends
Image adapted from S. Ayala Pelaez et al., NREL/CP-5K00-72039,
2018
ARRAY FOLLOW THE SUN.
TECHNOLOGIES
FOLLOW THE LEADER.
Pelaez et al. Model and Validation of Single-axis tracking with bifacial PV. IEEE Journal of Photovoltaics, vol. 9, no.3, May 2019.
Field Testing Meets Modeling: Validated Data on Bifacial Solar Performance. Kyumin Lee, Array Technologies. BiFi July 2020.
Y Position along row [m]
tecnalia
Inspiring
Business
H=0.4 BG [%]
E
H=0.75 BG [%]
-15
-15
13
13
-10
12
-10
12
72
11
-5
0
6
5
8
Y Position along row [m]
11
5
10
0
9
5
8
7
7
10
10
6
6
15
15
5
5
-1 0 1
-1
0 1
X Position [m]
X Position [m]
(a)
(b)
Yearly cumulative distribution of BGE across the
center row of a 20-module x 7-row single-axis-
tracking array for (a) H = 0.4 and (b) H = 0.75. BGE
is significantly higher (13.9%) at the edges of the
row. Radiance simulation. GCR = 0.35,
Albuquerque climate.
GoPV Project | 1st TRAINING COURSES
TECHNICAL FOCUS ON FUTURE SOLAR PV SYSTEMS
4
October 26-29th 2020View entire presentation