Summer 2023 Solar Industry Update
U.S. Installation Breakdown
Annual: EIA (GWac)
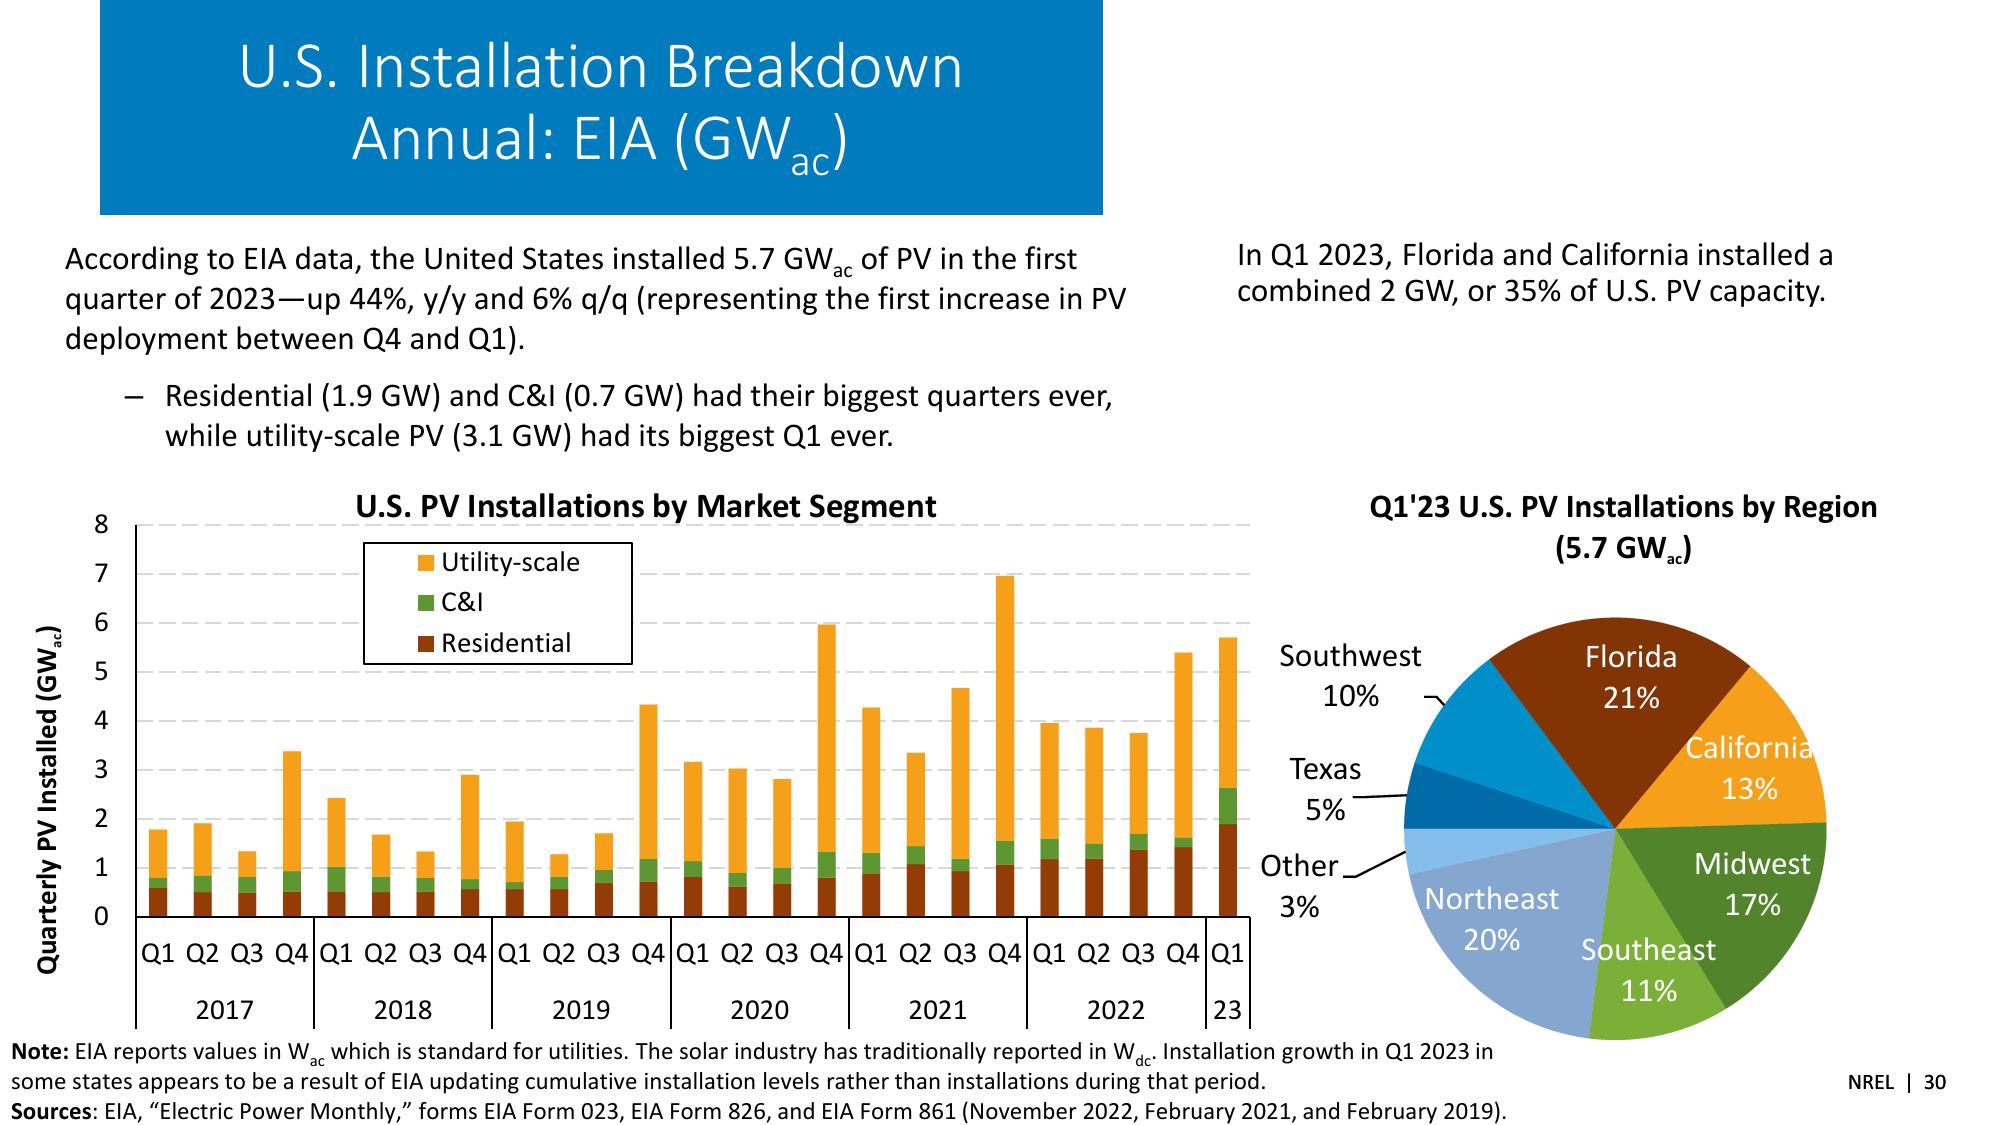
According to EIA data, the United States installed 5.7 GWac of PV in the first
quarter of 2023-up 44%, y/y and 6% q/q (representing the first increase in PV
deployment between Q4 and Q1).
Residential (1.9 GW) and C&I (0.7 GW) had their biggest quarters ever,
while utility-scale PV (3.1 GW) had its biggest Q1 ever.
In Q1 2023, Florida and California installed a
combined 2 GW, or 35% of U.S. PV capacity.
8
7
Quarterly PV Installed (GW₁c)
0
3
S
6
U.S. PV Installations by Market Segment
Utility-scale
■C&I
■Residential
Q1 Q2 Q3 Q4 Q1 Q2 Q3 Q4 Q1 Q2 Q3 Q4 Q1 Q2 Q3 Q4 Q1 Q2 Q3 Q4 Q1 Q2 Q3 Q4 Q1
2017
2018
2019
2020
2021
2022
23
Q1'23 U.S. PV Installations by Region
(5.7 GWac)
Southwest
10%
Florida
21%
California
Texas
5%
13%
Other
3%
Northeast
Midwest
17%
20%
Southeast
11%
Note: EIA reports values in Wac which is standard for utilities. The solar industry has traditionally reported in Wdc. Installation growth in Q1 2023 in
some states appears to be a result of EIA updating cumulative installation levels rather than installations during that period.
Sources: EIA, "Electric Power Monthly," forms EIA Form 023, EIA Form 826, and EIA Form 861 (November 2022, February 2021, and February 2019).
NREL 30View entire presentation