Aston Martin Lagonda Results Presentation Deck
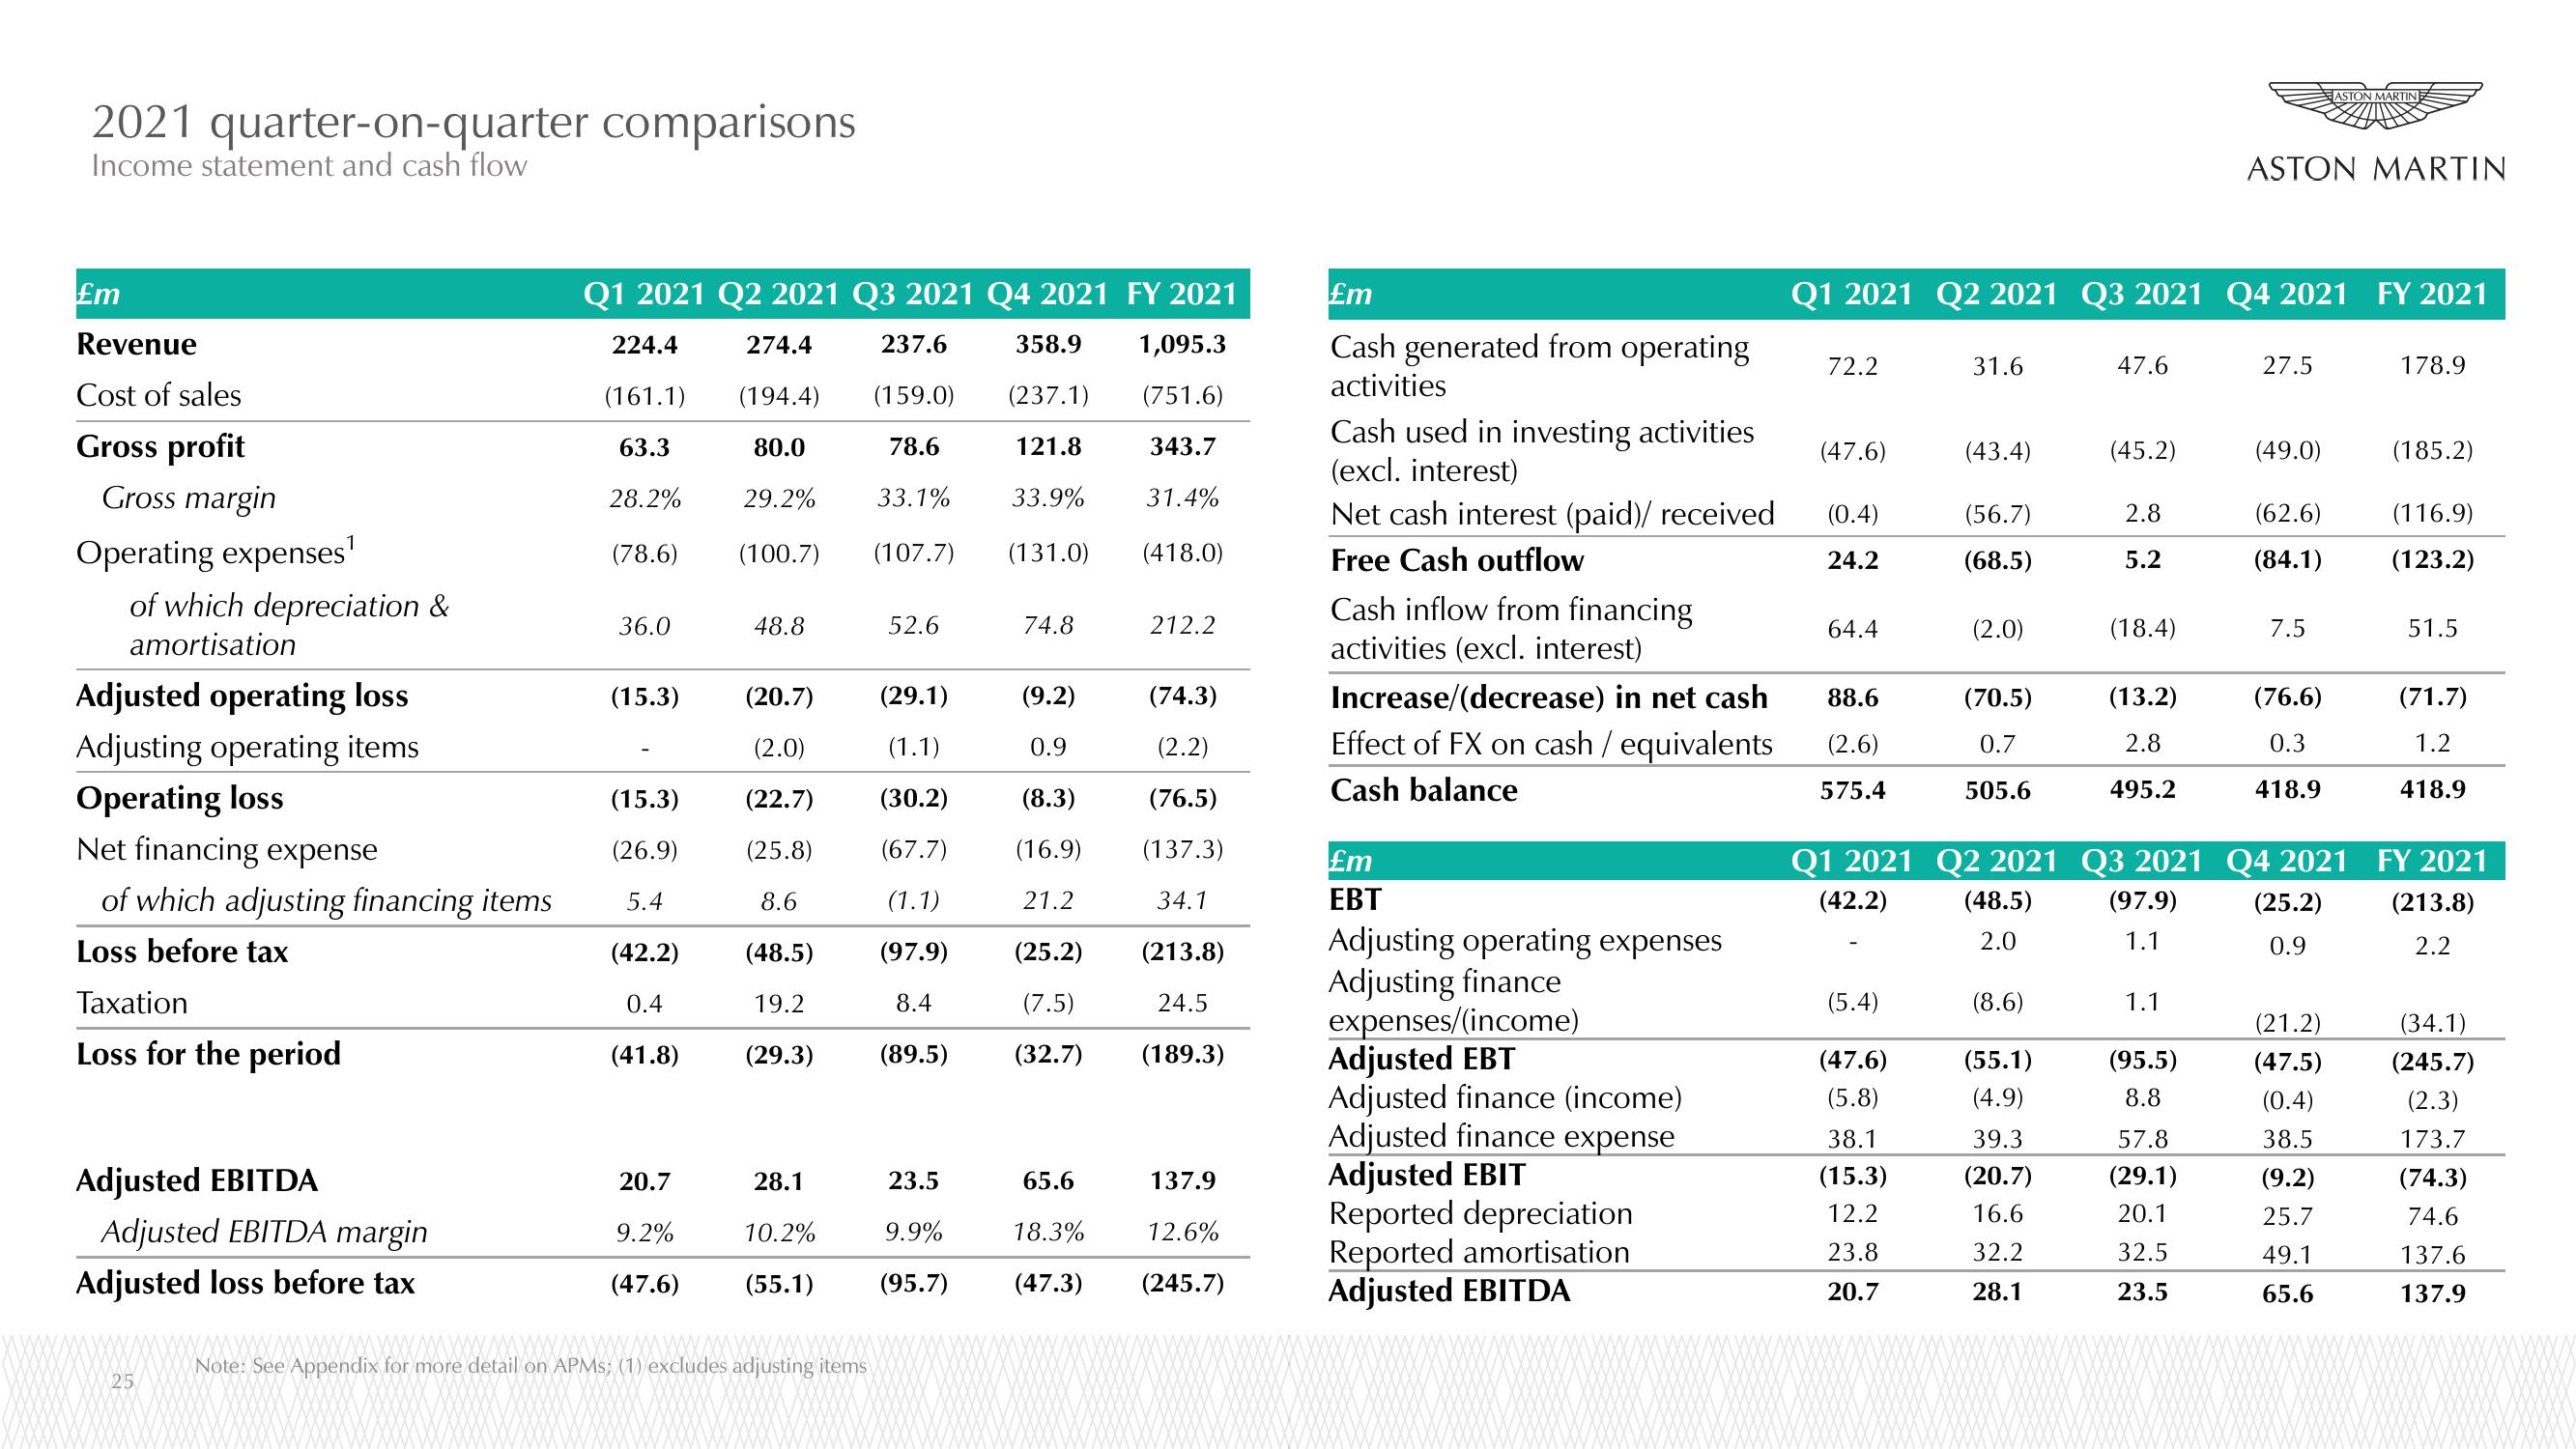
2021 quarter-on-quarter comparisons
Income statement and cash flow
£m
Revenue
Cost of sales
Gross profit
Gross margin
Operating expenses¹
of which depreciation &
amortisation
Adjusted operating loss
Adjusting operating items
Operating loss
Net financing expense
of which adjusting financing items
Loss before tax
Taxation
Loss for the period
Adjusted EBITDA
Adjusted EBITDA margin
Adjusted loss before tax
25
Q1 2021 Q2 2021 Q3 2021 Q4 2021 FY 2021
224.4
(161.1)
63.3
28.2%
274.4
(194.4)
80.0
29.2%
237.6
(159.0)
78.
33.1%
358.9
(237.1)
121.8
33.9%
(131.0)
1,095.3
(751.6)
343.7
31.4%
(418.0)
(78.6)
(100.7) (107.7)
36.0
(15.3)
(15.3)
(26.9)
5.4
(42.2)
0.4
(41.8)
20.7
9.2%
(47.6)
48.8
(20.7)
(2.0)
(22.7)
(25.8)
8.6
(48.5)
19.2
(29.3)
28.1
10.2%
(55.1)
Note: See Appendix for more detail on APMs; (1) excludes adjusting items
52.6
(29.1)
(1.1)
(30.2)
(67.7)
(1.1)
(97.9)
8.4
(89.5)
23.5
9.9%
(95.7)
74.8
(9.2)
0.9
(8.3)
(16.9)
21.2
(25.2)
(7.5)
(32.7)
65.6
18.3%
(47.3)
212.2
(74.3)
(2.2)
(76.5)
(137.3)
34.1
(213.8)
24.5
(189.3)
137.9
12.6%
(245.7)
£m
Cash generated from operating
activities
Cash used in investing activities
(excl. interest)
Net cash interest (paid)/ received
Free Cash outflow
Cash inflow from financing
activities (excl. interest)
Increase/(decrease) in net cash
Effect of FX on cash / equivalents
Cash balance
£m
EBT
Adjusting operating expenses
Adjusting finance
expenses/(income)
Adjusted EBT
Adjusted finance (income)
Adjusted finance expense
Adjusted EBIT
Reported depreciation
Reported amortisation
Adjusted EBITDA
72.2
Q1 2021 Q2 2021 Q3 2021 Q4 2021
(47.6)
(0.4)
24.2
64.4
88.6
(2.6)
575.4
(5.4)
(47.6)
(5.8)
31.6
38.1
(15.3)
12.2
23.8
20.7
(43.4)
(56.7)
(68.5)
(2.0)
(70.5)
0.7
505.6
(8.6)
(55.1)
(4.9)
47.6
39.3
(20.7)
16.6
32.2
28.1
(45.2)
2.8
5.2
(18.4)
(13.2)
2.8
495.2
1.1
(95.5)
8.8
ASTON MARTIN
Q1 2021 Q2 2021 Q3 2021 Q4 2021
(42.2)
(48.5)
(97.9)
(25.2)
2.0
1.1
0.9
57.8
(29.1)
20.1
32.5
23.5
27.5
(49.0)
(62.6)
(84.1)
7.5
(76.6)
0.3
418.9
ASTON MARTIN
(21.2)
(47.5)
(0.4)
38.5
(9.2)
25.7
49.1
65.6
FY 2021
178.9
(185.2)
(116.9)
(123.2)
51.5
(71.7)
1.2
418.9
FY 2021
(213.8)
2.2
(34.1)
(245.7)
(2.3)
173.7
(74.3)
74.6
137.6
137.9View entire presentation