Comera Investor Presentation Deck
Partnership Value Generated Through Multiple Stages
Feasibility Evaluation
Revenue generating research collaboration to
assess feasibility
License Option Exercise
Potential $multi-million upfront payment to license
SQore technology
Milestones
Potential $multi-million payments upon
achievement of key development milestones
Royalties
Potential single to mid teen % royalty on
product sales
100%
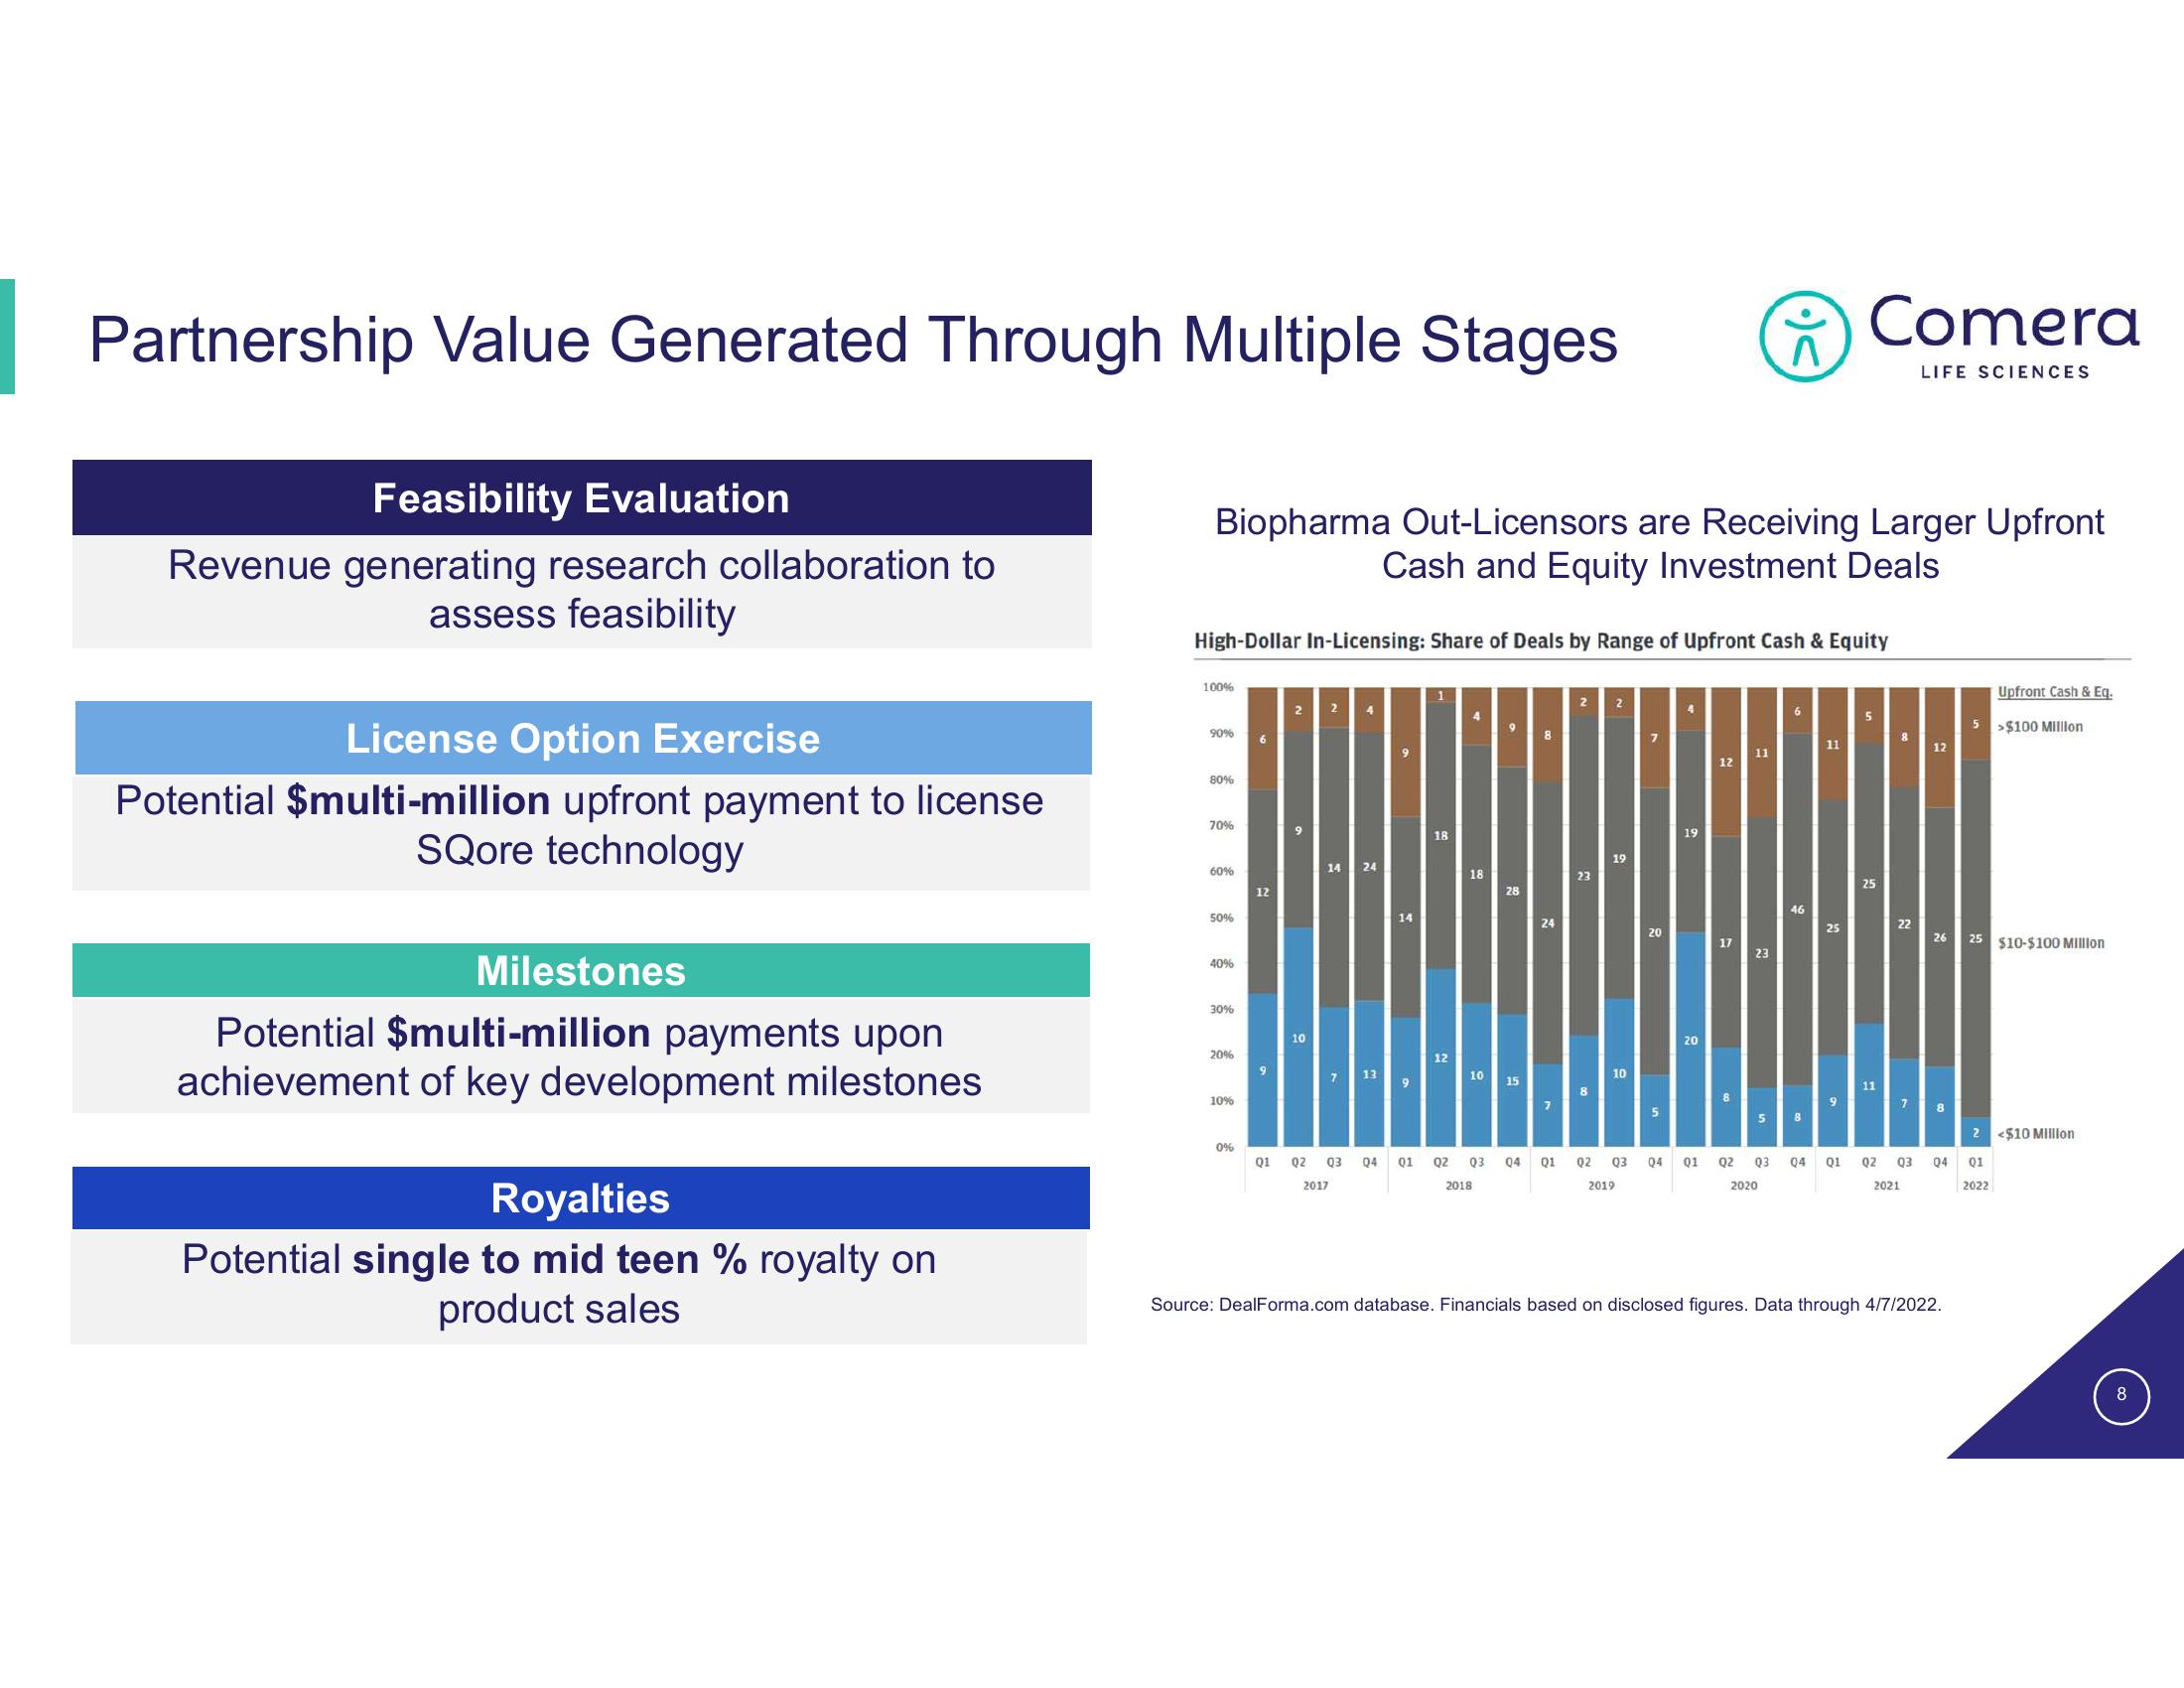
Biopharma Out-Licensors are Receiving Larger Upfront
Cash and Equity Investment Deals
High-Dollar In-Licensing: Share of Deals by Range of Upfront Cash & Equity
90%
80%
70%
60%
50%
40%
30%
20%
10%
0%
6
12
9
2
10
2
4
14 24
2017
7 13
Q1 02 Q3 Q4
14
9
01
18
12
4
18
10
Q2 Q3
2018
9
28
15
8
24
7
04 Q1
23
8
2
19
10
7
20
5
Q2 03 04
2019
4
19
20
01
12
17
8
11
23
(
5
2020
6
46
8
Q2 Q3 04
11
25
Comera
9
Q1
5
25
11
8
22
LIFE SCIENCES
7
2021
12
26
8
02 03 04
Source: DealForma.com database. Financials based on disclosed figures. Data through 4/7/2022.
5
Upfront Cash & Eq.
>$100 Million
25 $10-$100 Million
2 <$10 Million
01
2022
8View entire presentation