Allwyn Results Presentation Deck
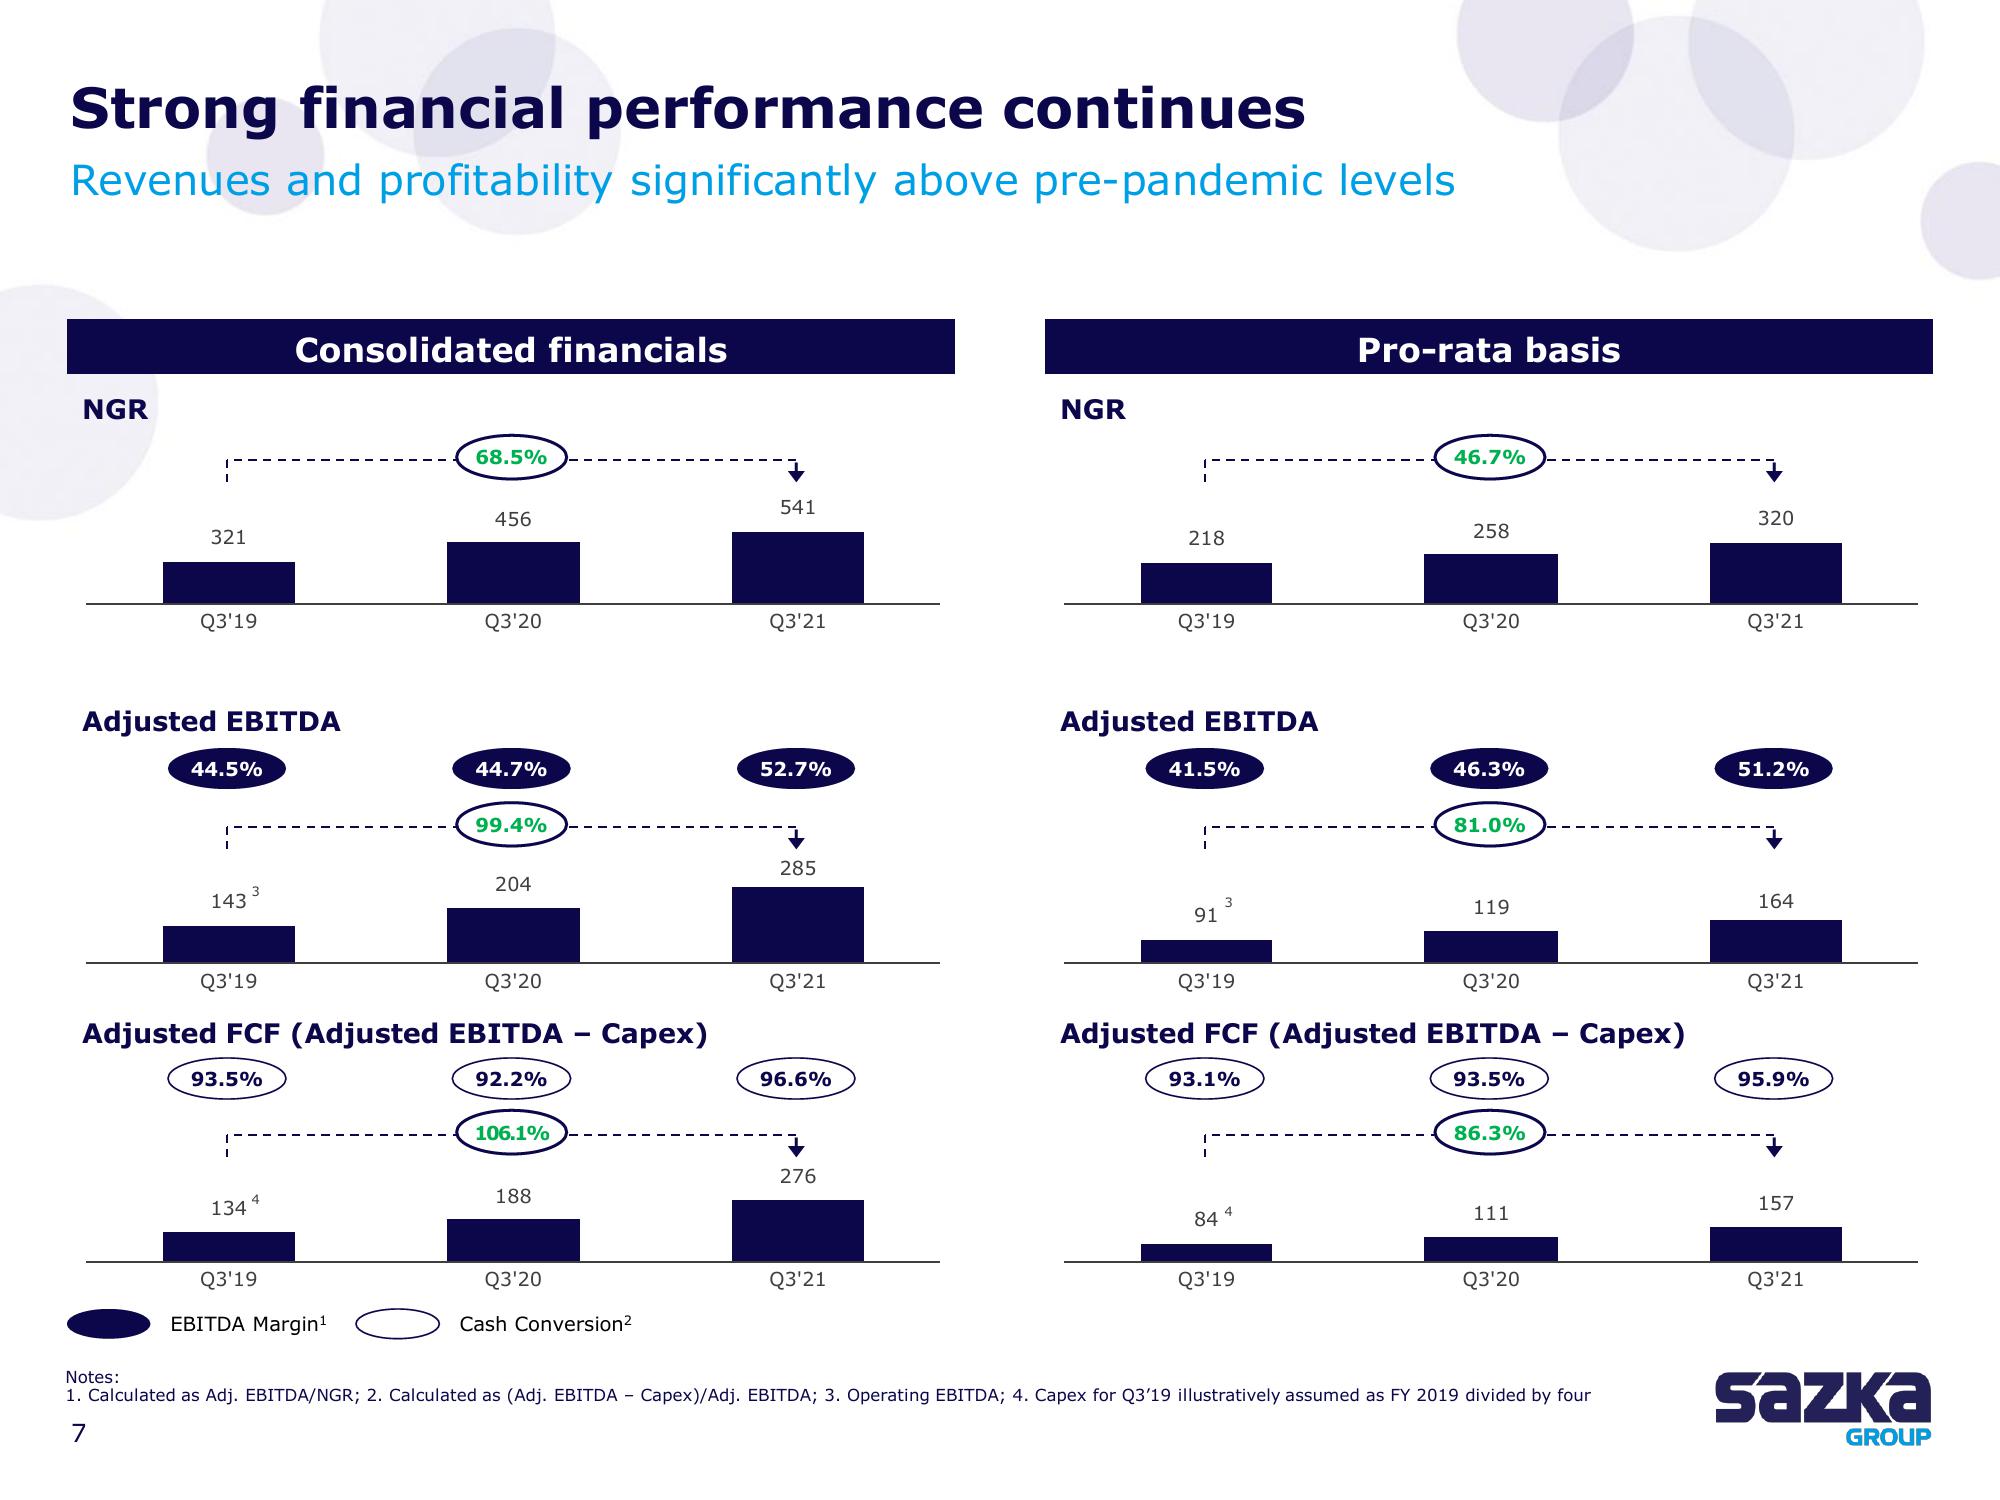
Strong financial performance continues
Revenues and profitability significantly above pre-pandemic levels
NGR
321
Q3'19
Adjusted EBITDA
44.5%
143
3
Q3'19
93.5%
I
Consolidated financials
1344
68.5%
Q3'19
EBITDA Margin¹
456
Q3'20
Q3'20
Adjusted FCF (Adjusted EBITDA - Capex)
92.2%
44.7%
99.4%
204
106.1%
188
Q3'20
Cash Conversion²
541
Q3'21
52.7%
285
Q3'21
96.6%
276
Q3'21
NGR
218
Q3'19
Adjusted EBITDA
41.5%
91
Q3'19
3
93.1%
I
84
4
Pro-rata basis
Q3'19
46.7%
Q3'20
Adjusted FCF (Adjusted EBITDA - Capex)
93.5%
258
Q3'20
46.3%
81.0%
119
86.3%
111
Q3'20
Notes:
1. Calculated as Adj. EBITDA/NGR; 2. Calculated as (Adj. EBITDA - Capex)/Adj. EBITDA; 3. Operating EBITDA; 4. Capex for Q3'19 illustratively assumed as FY 2019 divided by four
7
320
Q3'21
51.2%
164
Q3'21
95.9%
157
Q3'21
Sazka
GROUPView entire presentation