WeWork Results Presentation Deck
Building Margin by market
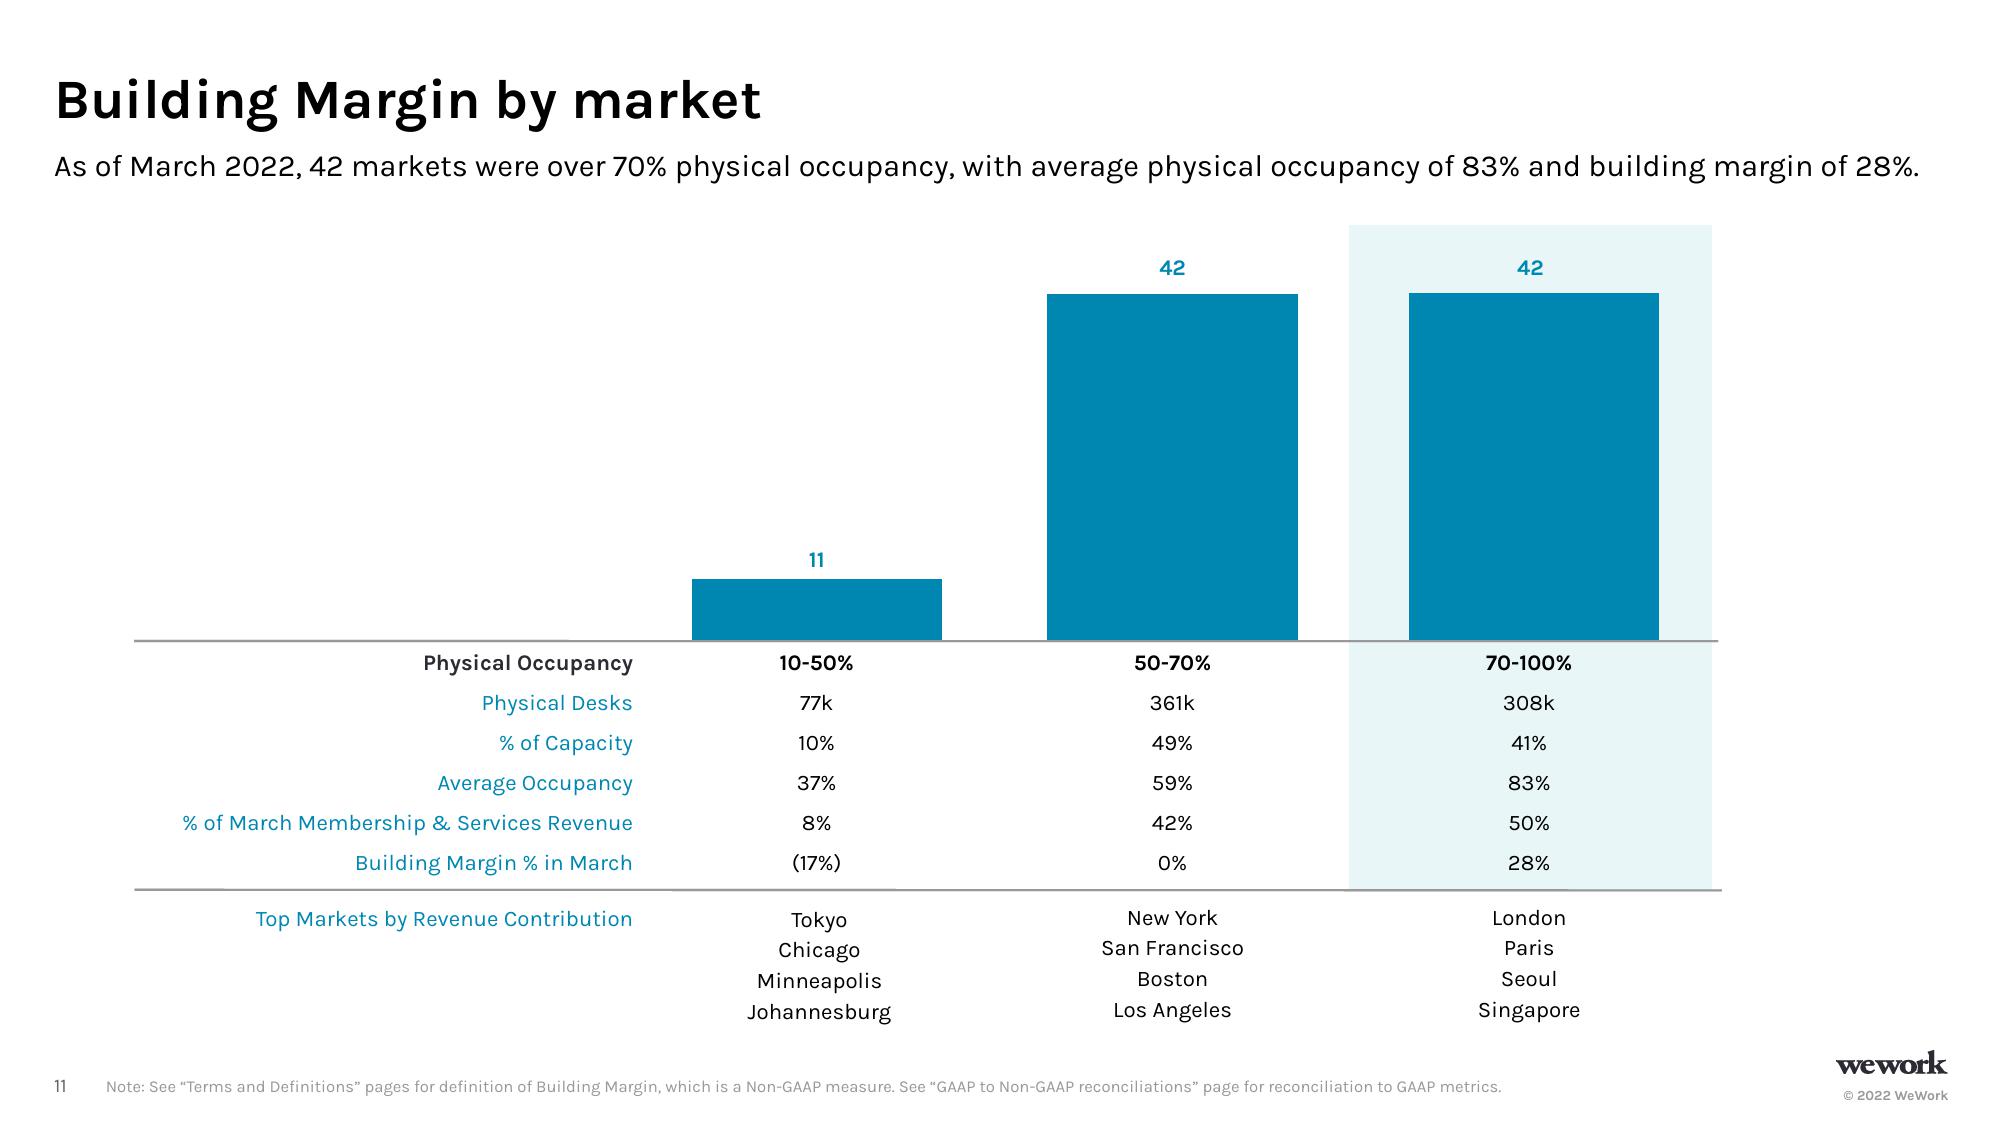
As of March 2022, 42 markets were over 70% physical occupancy, with average physical occupancy of 83% and building margin of 28%.
11
Physical Occupancy
Physical Desks
% of Capacity
Average Occupancy
% of March Membership & Services Revenue
Building Margin % in March
Top Markets by Revenue Contribution
11
10-50%
77k
10%
37%
8%
(17%)
Tokyo
Chicago
Minneapolis
Johannesburg
42
50-70%
361k
49%
59%
42%
0%
New York
San Francisco
Boston
Los Angeles
42
70-100%
308k
41%
83%
50%
28%
London
Paris
Seoul
Singapore
Note: See "Terms and Definitions" pages for definition of Building Margin, which is a Non-GAAP measure. See "GAAP to Non-GAAP reconciliations" page for reconciliation to GAAP metrics.
wework
Ⓒ2022 WeWorkView entire presentation