GlobalFoundries Results Presentation Deck slide image

GlobalFoundries Results Presentation Deck

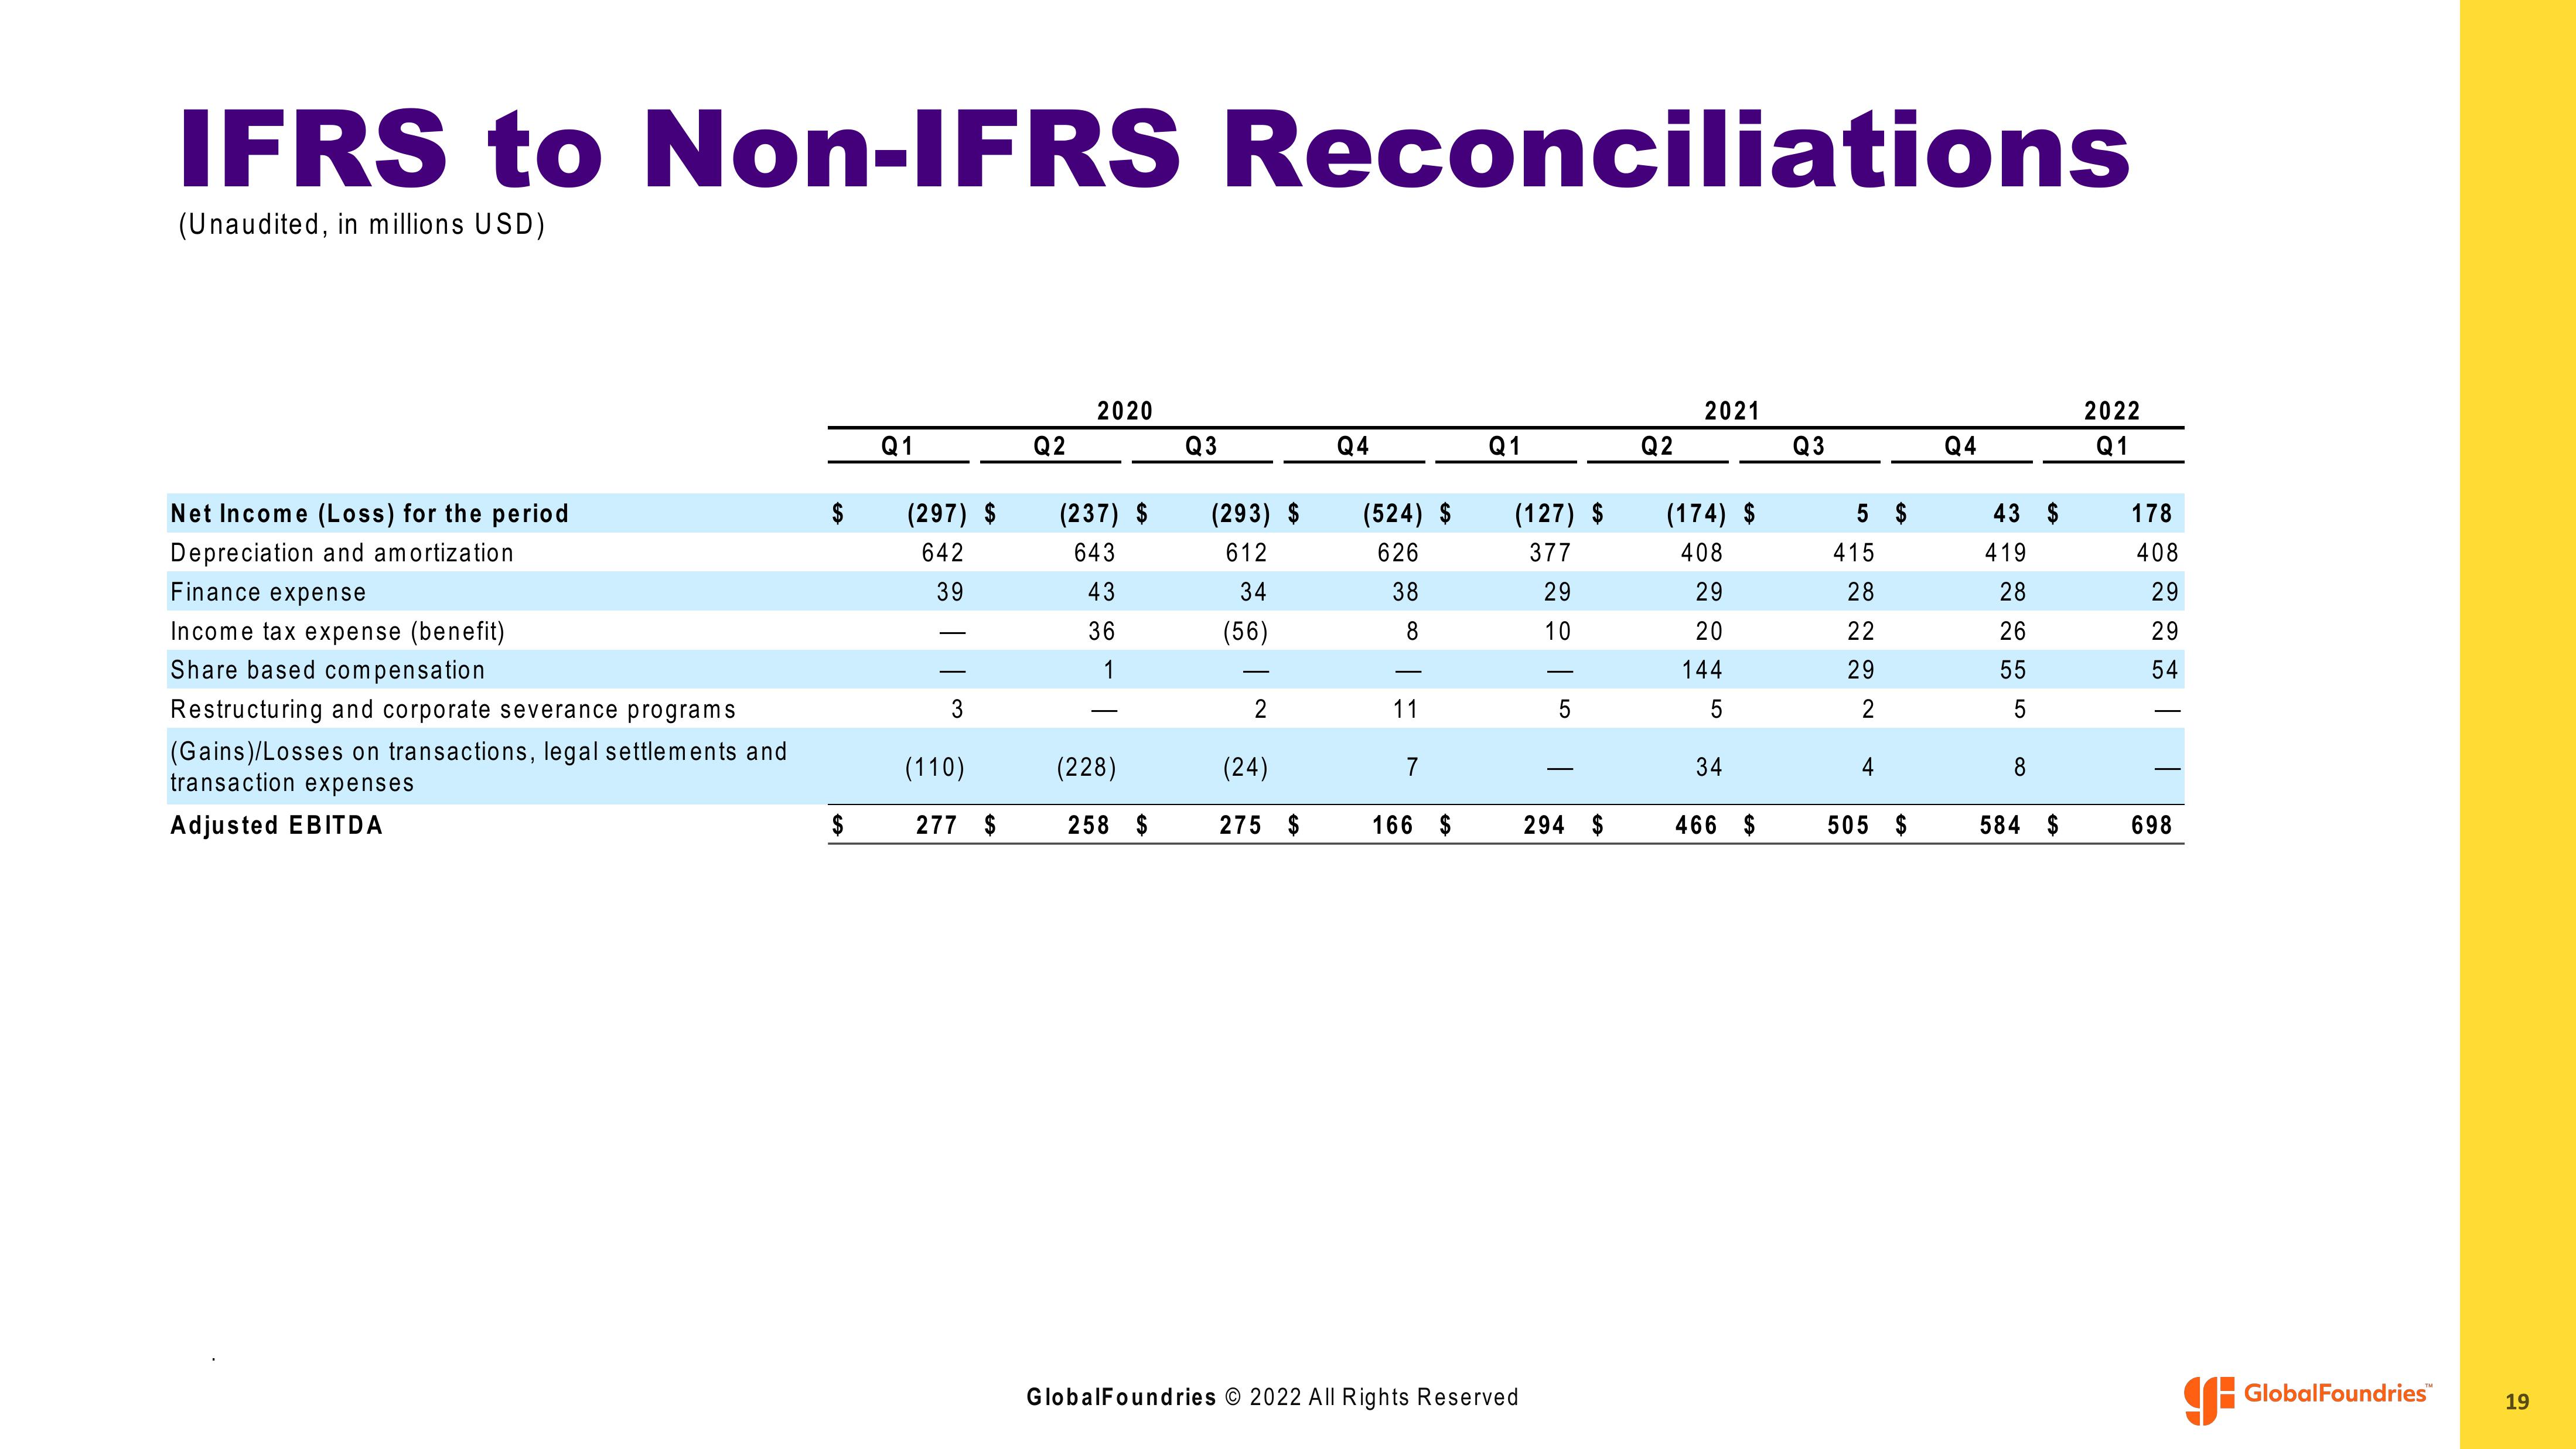
IFRS to Non-IFRS Reconciliations (Unaudited, in millions USD) Net Income (Loss) for the period Depreciation and amortization Finance expense Income tax expense (benefit) Share based compensation Restructuring and corporate severance programs (Gains)/Losses on transactions, legal settlements and transaction expenses Adjusted EBITDA $ $ Q1 (297) $ 642 39 3 (110) 277 $ Q2 2020 (237) $ 643 43 36 1 (228) 258 $ Q3 (293) $ 612 34 (56) - 2 (24) 275 $ Q4 (524) $ 626 38 8 - 11 7 166 $ Q1 (127) $ 377 29 10 GlobalFoundries © 2022 All Rights Reserved 5 294 $ Q2 2021 (174) $ 408 29 20 144 5 34 466 $ Q3 5 $ 415 28 22 29 2 4 505 $ Q4 43 419 28 26 55 5 8 $ 584 $ 2022 Q1 178 408 29 29 54 T 698 GlobalFoundries 19
View entire presentation