WeWork Investor Presentation Deck
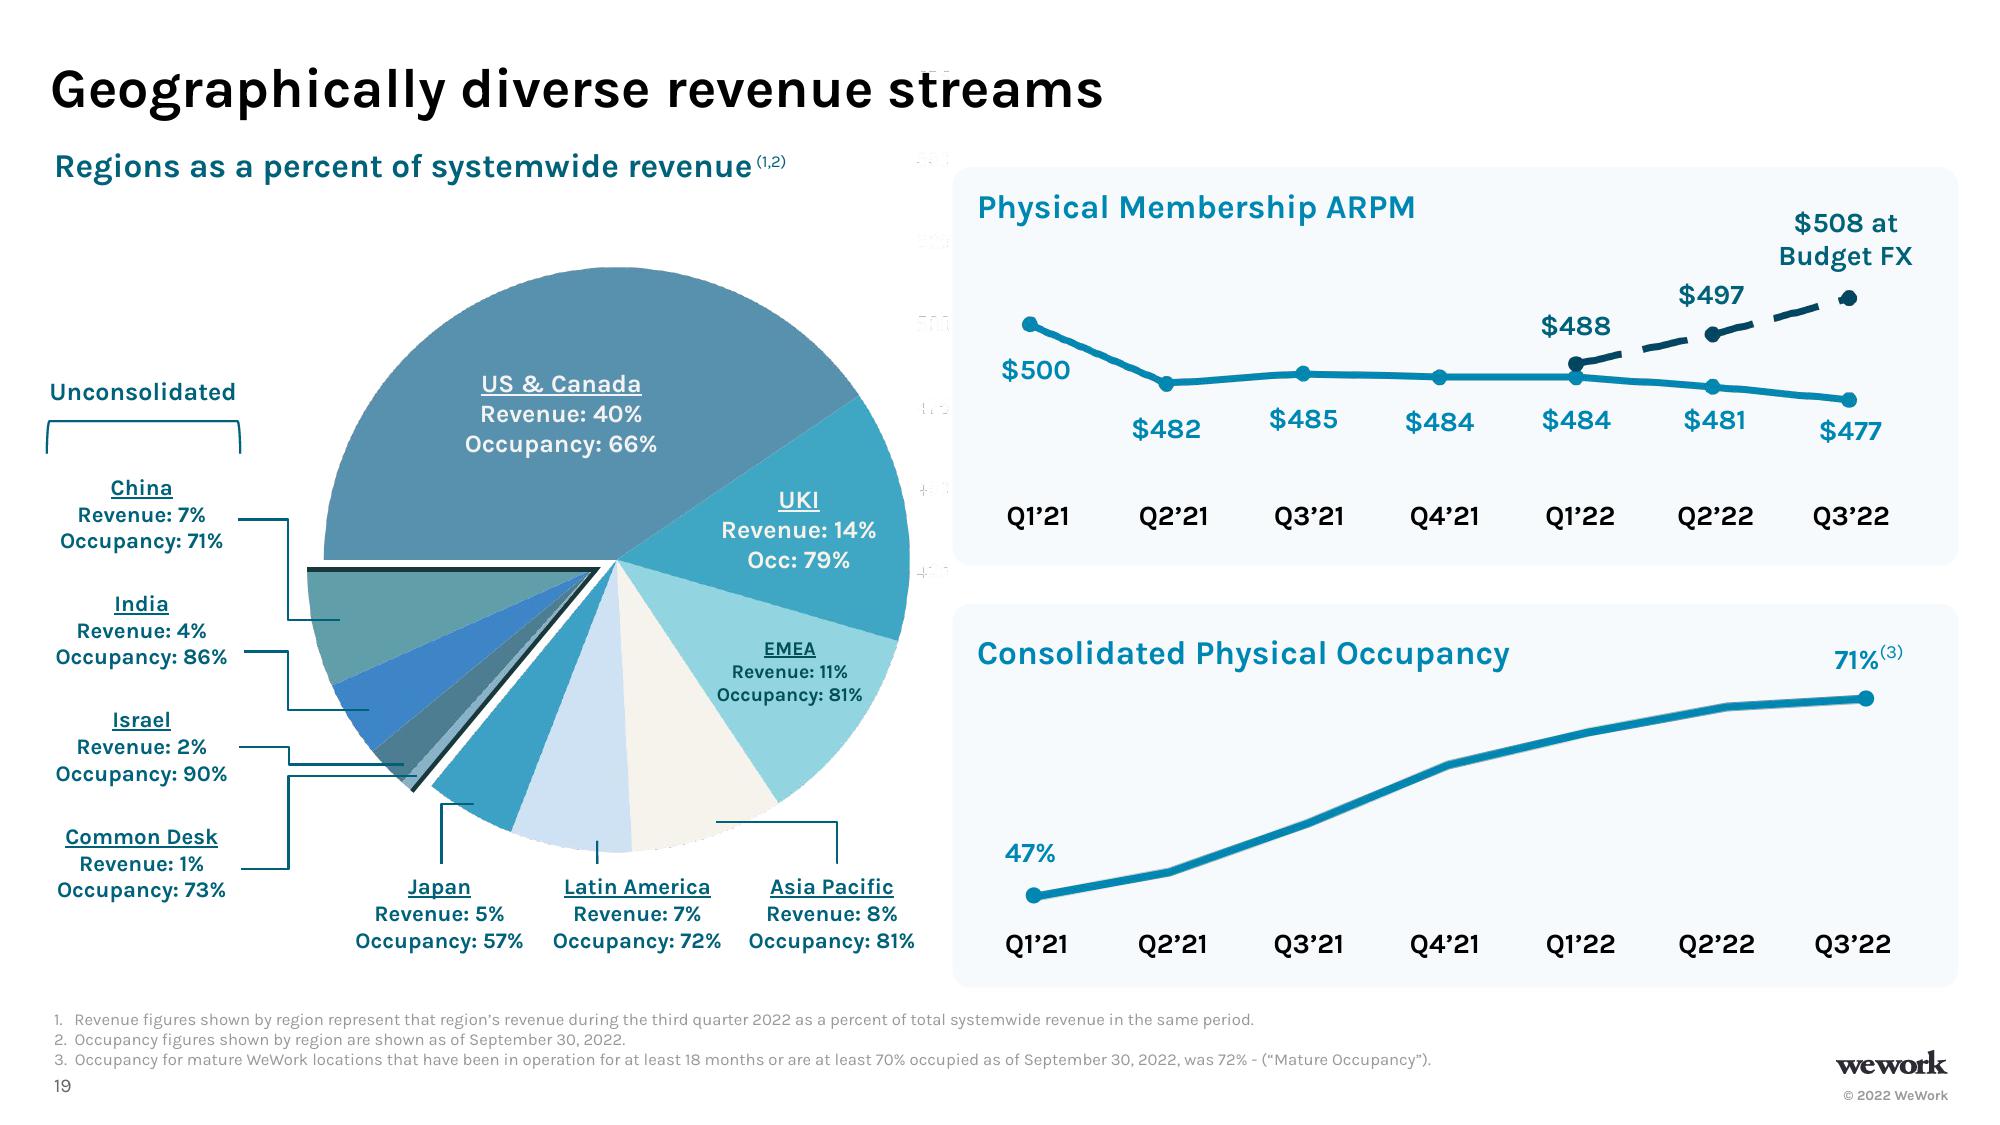
Geographically diverse revenue streams
Regions as a percent of systemwide revenue (¹.2)
Unconsolidated
China
Revenue: 7%
Occupancy: 71%
India
Revenue: 4%
Occupancy: 86%
Israel
Revenue: 2%
Occupancy: 90%
Common Desk
Revenue: 1%
Occupancy: 73%
US & Canada
Revenue: 40%
Occupancy: 66%
Japan
Revenue: 5%
Occupancy: 57%
UKI
Revenue: 14%
Occ: 79%
EMEA
Revenue: 11%
Occupancy: 81%
Latin America
Revenue: 7%
Occupancy: 72%
Asia Pacific
Revenue: 8%
Occupancy: 81%
Physical Membership ARPM
$500
Q1'21
47%
$482
Q1'21
$485 $484
Consolidated Physical Occupancy
Q2'21 Q3'21 Q4'21
Q2'21 Q3'21 Q4'21
1. Revenue figures shown by region represent that region's revenue during the third quarter 2022 as a percent of total systemwide revenue in the same period.
2. Occupancy figures shown by region are shown as of September 30, 2022.
3. Occupancy for mature WeWork locations that have been in operation for at least 18 months or are at least 70% occupied as of September 30, 2022, was 72% - ("Mature Occupancy").
19
$488
$484
$497
$481
Q1'22 Q2'22
Q1'22 Q2'22
$508 at
Budget FX
$477
Q3'22
71% (3)
Q3'22
wework
Ⓒ2022 WeWorkView entire presentation