Zegna Results Presentation Deck
GROUP REVENUES BY GEOGRAPHICAL AREAkErmenegildo Zegna Group
(UNAUDITED)
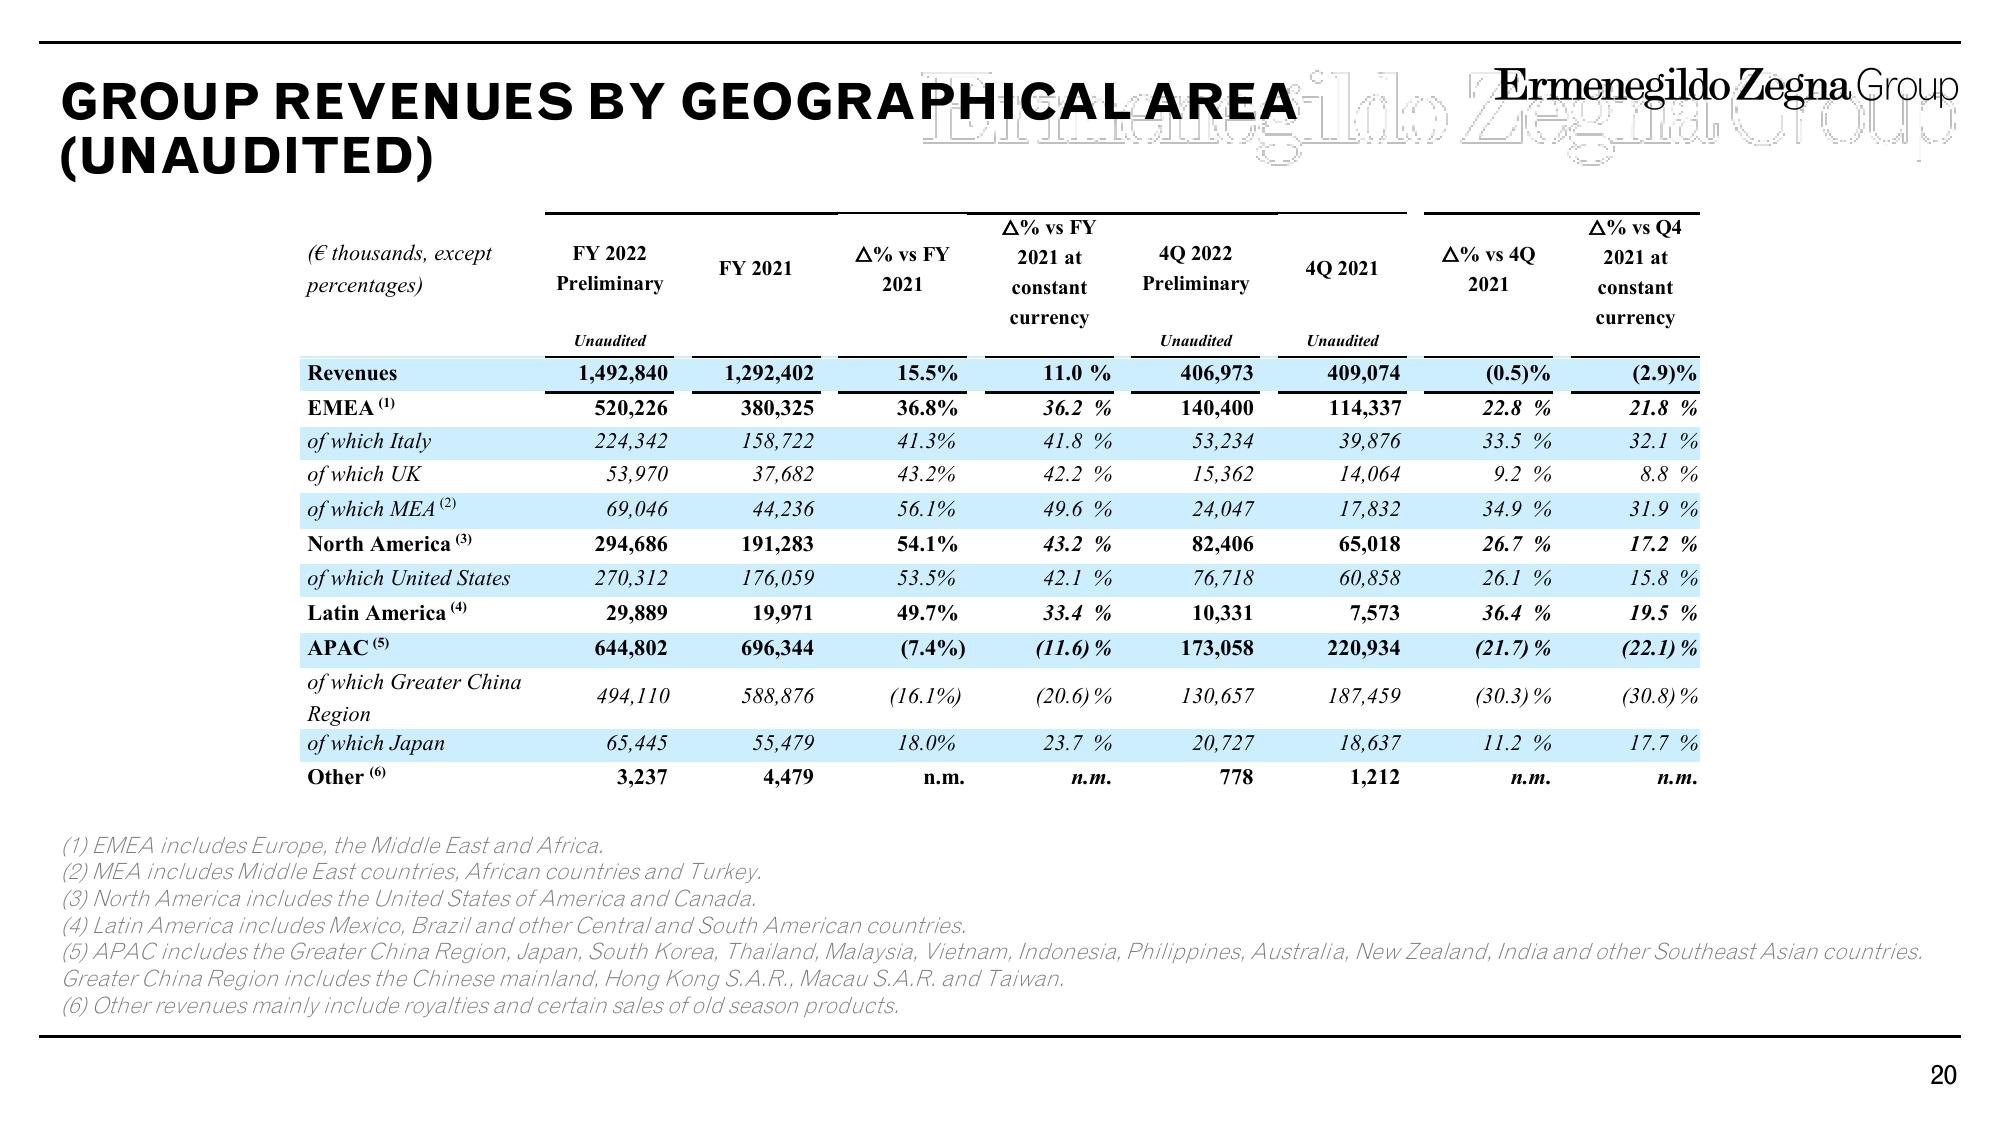
(€ thousands, except
percentages)
Revenues
EMEA (¹)
of which Italy
of which UK
of which MEA (2²)
North America (3)
of which United States
Latin America (4)
APAC (5)
of which Greater China
Region
of which Japan
Other (6)
FY 2022
Preliminary
Unaudited
1,492,840
520,226
224,342
53,970
69,046
294,686
270,312
29,889
644,802
494,110
65,445
3,237
FY 2021
1,292,402
380,325
158,722
37,682
44,236
191,283
176,059
19,971
696,344
588,876
55,479
4,479
A% vs FY
2021
15.5%
36.8%
41.3%
43.2%
56.1%
54.1%
53.5%
49.7%
(7.4%)
(16.1%)
18.0%
n.m.
A% vs FY
2021 at
constant
currency
11.0 %
36.2%
41.8 %
42.2 %
49.6 %
43.2 %
42.1%
33.4%
(11.6) %
(20.6)%
23.7 %
n.m.
4Q 2022
Preliminary
Unaudited
406,973
140,400
53,234
15,362
24,047
82,406
76,718
10,331
173,058
130,657
20,727
778
4Q 2021
Unaudited
409,074
114,337
39,876
14,064
17,832
65,018
60,858
7,573
220,934
187,459
18,637
1,212
A% vs 4Q
2021
(0.5)%
22.8%
33.5 %
9.2 %
34.9 %
26.7 %
26.1%
36.4 %
(21.7) %
(30.3)%
11.2 %
n.m.
A% vs Q4
2021 at
constant
currency
(2.9)%
21.8%
32.1 %
8.8 %
31.9 %
17.2 %
15.8 %
19.5 %
(22.1)%
(30.8)%
17.7 %
n.m.
(1) EMEA includes Europe, the Middle East and Africa.
(2) MEA includes Middle East countries, African countries and Turkey.
(3) North America includes the United States of America and Canada.
(4) Latin America includes Mexico, Brazil and other Central and South American countries.
(5) APAC includes the Greater China Region, Japan, South Korea, Thailand, Malaysia, Vietnam, Indonesia, Philippines, Australia, New Zealand, India and other Southeast Asian countries.
Greater China Region includes the Chinese mainland, Hong Kong S.A.R., Macau S.A.R. and Taiwan.
(6) Other revenues mainly include royalties and certain sales of old season products.
20View entire presentation