BlackRock Global Long/Short Credit Absolute Return Credit
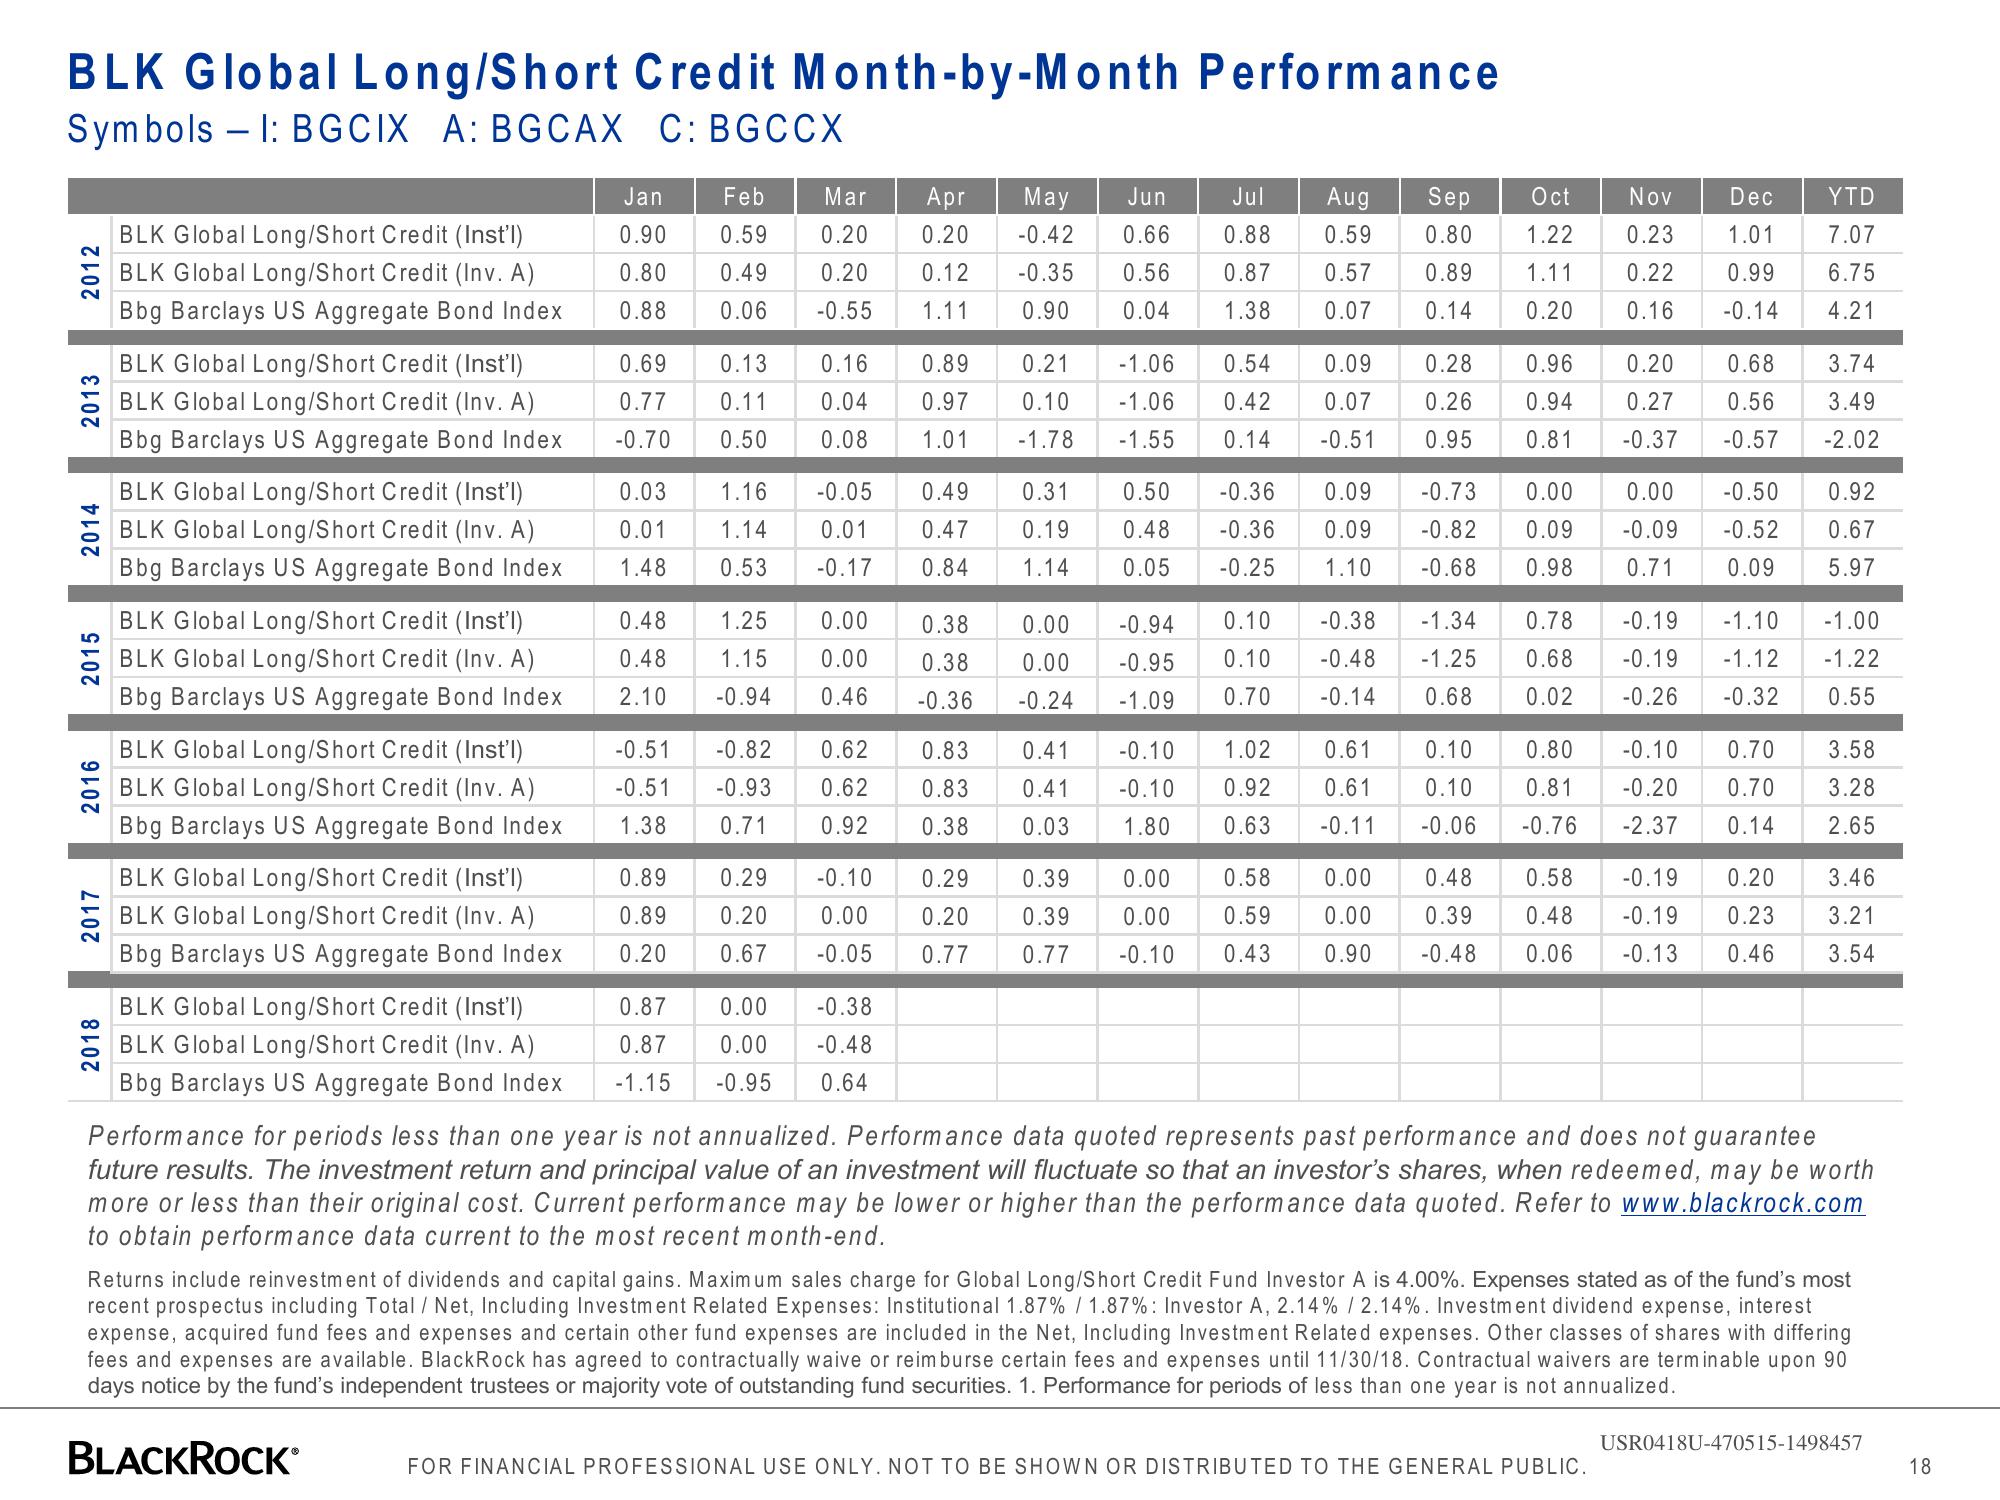
BLK Global Long/Short Credit Month-by-Month Performance
Symbols - I: BGCIX A: BGCAX C: BGCCX
2012
2013
2014
2015
2016
2017
2018
BLK Global Long/Short Credit (Inst'l)
BLK Global Long/Short Credit (Inv. A)
Bbg Barclays US Aggregate Bond Index
BLK Global Long/Short Credit (Inst'l)
BLK Global Long/Short Credit (Inv. A)
Bbg Barclays US Aggregate Bond Index
BLK Global Long/Short Credit (Inst'l)
BLK Global Long/Short Credit (Inv. A)
Bbg Barclays US Aggregate Bond Index
BLK Global Long/Short Credit (Inst'l)
BLK Global Long/Short Credit (Inv. A)
Bbg Barclays US Aggregate Bond Index
BLK Global Long/Short Credit (Inst'l)
BLK Global Long/Short Credit (Inv. A)
Bbg Barclays US Aggregate Bond Index
BLK Global Long/Short Credit (Inst'l)
BLK Global Long/Short Credit (Inv. A)
Bbg Barclays US Aggregate Bond Index
Jan
0.90
0.80
0.88
0.69
0.77
-0.70
0.48
0.48
2.10
0.03
1.16
0.01
1.14
1.48 0.53
-0.51
-0.51
1.38
0.89
0.89
0.20
Feb
0.59
0.49
0.06
BLK Global Long/Short Credit (Inst'l)
0.87
BLK Global Long/Short Credit (Inv. A)
0.87
Bbg Barclays US Aggregate Bond Index -1.15
Mar
Apr
May Jun
Jul
Aug
0.20 -0.42 0.66 0.88
0.59
0.20
0.20 0.12 -0.35 0.56 0.87 0.57
-0.55
1.11 0.90 0.04 1.38
0.07
0.13
0.11 0.04
0.50
0.08
0.16 0.89 0.21 -1.06 0.54
0.97 0.10 -1.06 0.42
1.01 -1.78 -1.55 0.14
0.29
0.20
0.67
-0.05
0.01
-0.17
1.25 0.00
1.15 0.00
-0.94 0.46
-0.82 0.62
-0.93 0.62
0.71 0.92 0.38
-0.10
0.00
-0.05
0.49 0.31
0.47 0.19
0.84 1.14
0.00
-0.38
0.00
-0.48
-0.95 0.64
0.38 0.00
-0.94
0.38 0.00 -0.95
-0.36 -0.24 -1.09
0.83 0.41 -0.10
0.83 0.41 -0.10
0.03 1.80
0.29
0.20
0.39 0.00
0.39 0.00
0.77 0.77 -0.10
0.09
0.07
-0.51
0.10 -0.38
0.10 -0.48
0.70 -0.14
0.50 -0.36 0.09 -0.73 0.00 0.00 -0.50
0.48 -0.36 0.09 -0.82 0.09 -0.09 -0.52
0.05 -0.25 1.10 -0.68 0.98 0.71 0.09
1.02 0.61
0.92 0.61
0.63 -0.11
0.58
0.59
0.43
Sep
0.80
Oct Nov Dec YTD
1.22 0.23 1.01 7.07
0.99 6.75
-0.14 4.21
0.22
0.16
0.89 1.11
0.14
0.20
0.96 0.20 0.68
0.28
0.26
0.95 0.81 -0.37 -0.57
0.94 0.27 0.56
-1.34 0.78 -0.19 -1.10
-1.25 0.68 -0.19 -1.12
0.68
-0.26 -0.32
0.02
0.80 -0.10 0.70
0.81 -0.20 0.70
-2.37 0.14
-0.76
0.10
0.10
-0.06
3.74
3.49
-2.02
0.92
0.67
5.97
-1.00
-1.22
0.55
FOR FINANCIAL PROFESSIONAL USE ONLY. NOT TO BE SHOWN OR DISTRIBUTED TO THE GENERAL PUBLIC.
3.58
3.28
2.65
0.00 0.48 0.58 -0.19 0.20 3.46
0.00 0.39 0.48 -0.19 0.23 3.21
0.90 -0.48 0.06 -0.13 0.46 3.54
Performance for periods less than one year is not annualized. Performance data quoted represents past performance and does not guarantee
future results. The investment return and principal value of an investment will fluctuate so that an investor's shares, when redeemed, may be worth
more or less than their original cost. Current performance may be lower or higher than the performance data quoted. Refer to www.blackrock.com
to obtain performance data current to the most recent month-end.
Returns include reinvestment of dividends and capital gains. Maximum sales charge for Global Long/Short Credit Fund Investor A is 4.00%. Expenses stated as of the fund's most
recent prospectus including Total / Net, Including Investment Related Expenses: Institutional 1.87% / 1.87%: Investor A, 2.14% / 2.14%. Investment dividend expense, interest
expense, acquired fund fees and expenses and certain other fund expenses are included in the Net, Including Investment Related expenses. Other classes of shares with differing
fees and expenses are available. BlackRock has agreed to contractually waive or reimburse certain fees and expenses until 11/30/18. Contractual waivers are terminable upon 90
days notice by the fund's independent trustees or majority vote of outstanding fund securities. 1. Performance for periods of less than one year is not annualized.
BLACKROCK
USR0418U-470515-1498457
18View entire presentation