Grab Results Presentation Deck
Deliveries
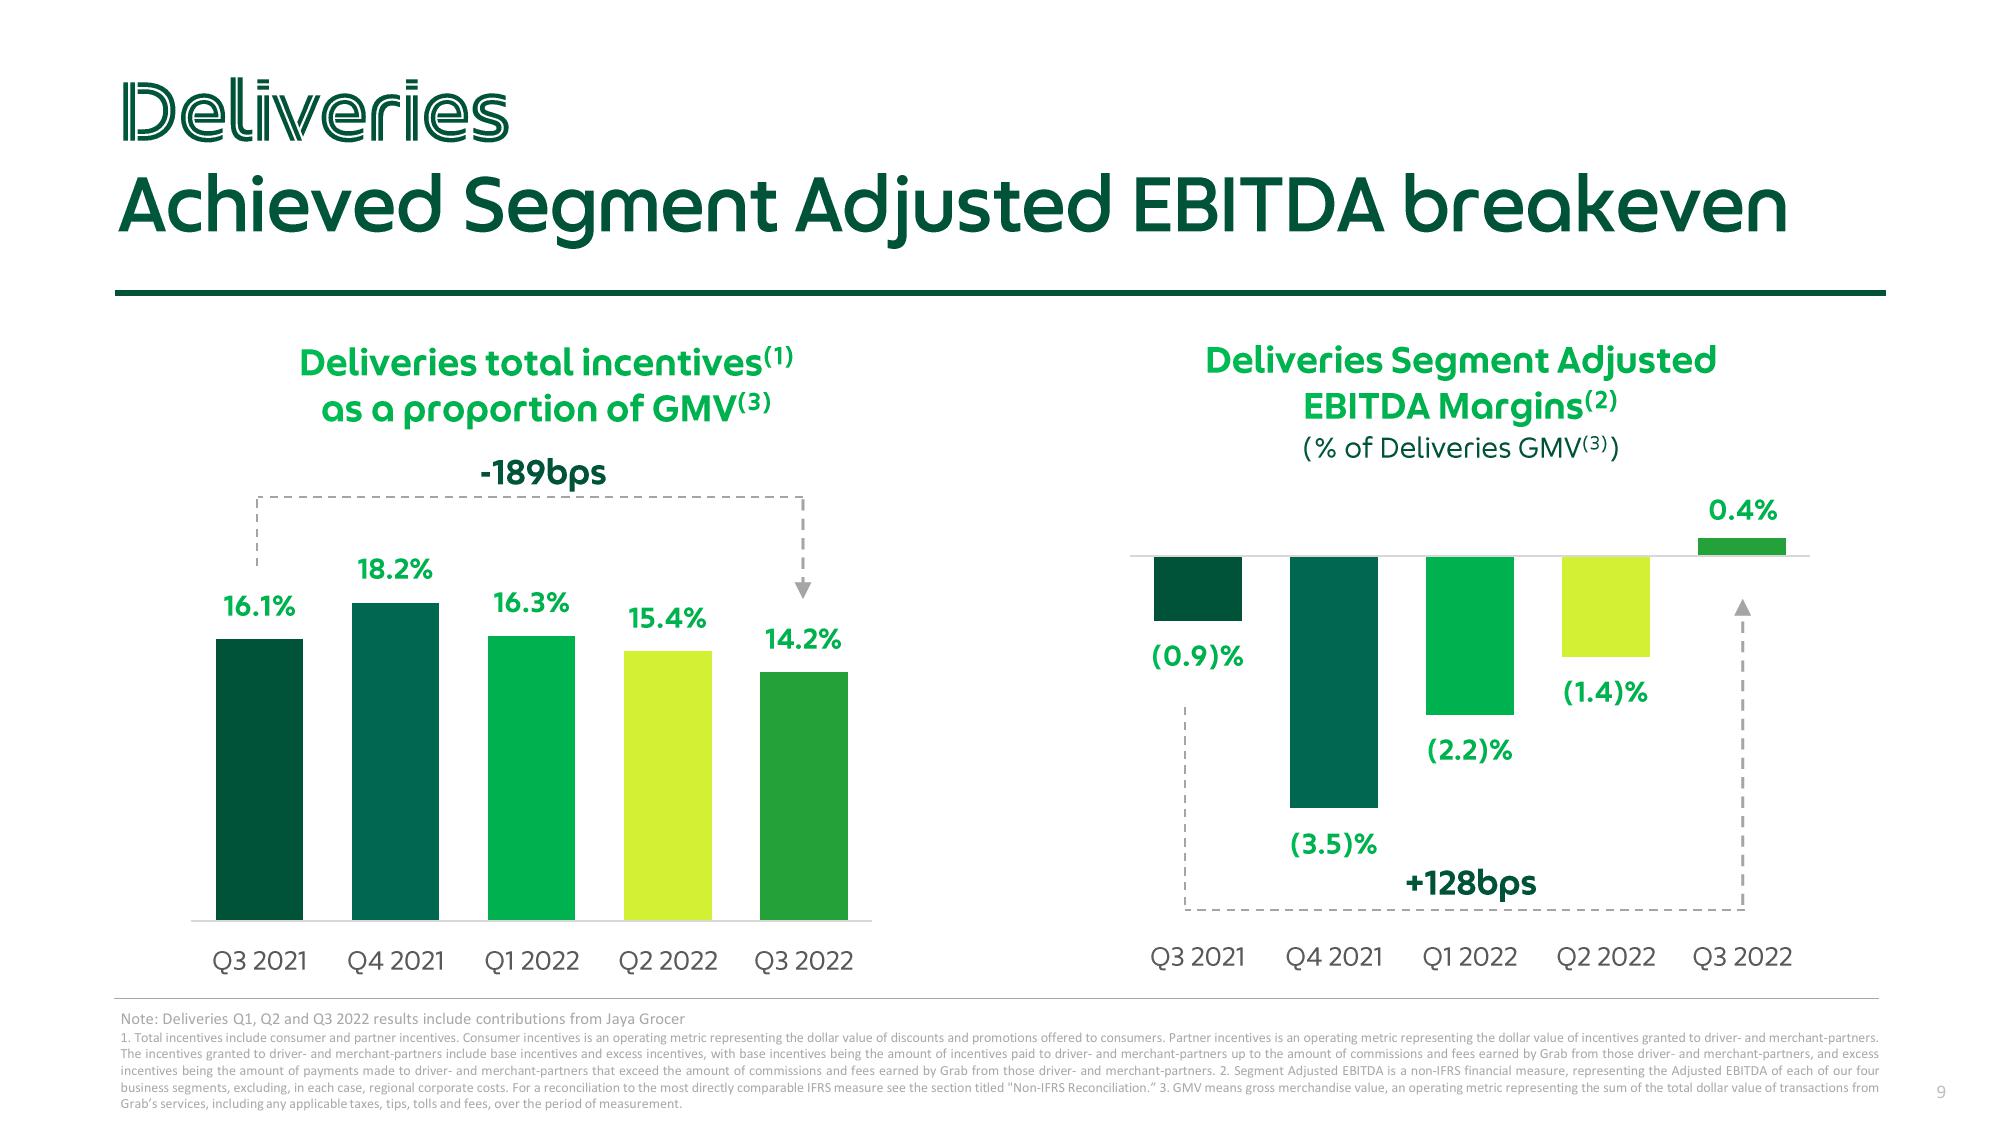
Achieved Segment Adjusted EBITDA breakeven
I
16.1%
Deliveries total incentives (1)
as a proportion of GMV(3)
-189bps
18.2%
16.3%
15.4%
14.2%
Deliveries Segment Adjusted
EBITDA Margins(2)
(% of Deliveries GMV(3))
(0.9)%
Q3 2021
(3.5)%
Q4 2021
(2.2)%
+128bps
Q1 2022
(1.4)%
0.4%
Q2 2022 Q3 2022
Q3 2021
Q4 2021
Q1 2022 Q2 2022 Q3 2022
Note: Deliveries Q1, Q2 and Q3 2022 results include contributions from Jaya Grocer
1. Total incentives include consumer and partner incentives. Consumer incentives is an operating metric representing the dollar value of discounts and promotions offered to consumers. Partner incentives is an operating metric representing the dollar value of incentives granted to driver- and merchant-partners.
The incentives granted to driver- and merchant-partners include base incentives and excess incentives, with base incentives being the amount of incentives paid to driver- and merchant-partners up to the amount of commissions and fees earned by Grab from those driver- and merchant-partners, and excess
incentives being the amount of payments made to driver- and merchant-partners that exceed the amount of commissions and fees earned by Grab from those driver- and merchant-partners. 2. Segment Adjusted EBITDA is a non-IFRS financial measure, representing the Adjusted EBITDA of each of our four
business segments, excluding, in each case, regional corporate costs. For a reconciliation to the most directly comparable IFRS measure see the section titled "Non-IFRS Reconciliation." 3. GMV means gross merchandise value, an operating metric representing the sum of the total dollar value of transactions from
Grab's services, including any applicable taxes, tips, tolls and fees, over the period of measurement.
9View entire presentation