Asos Results Presentation Deck
2023 asos
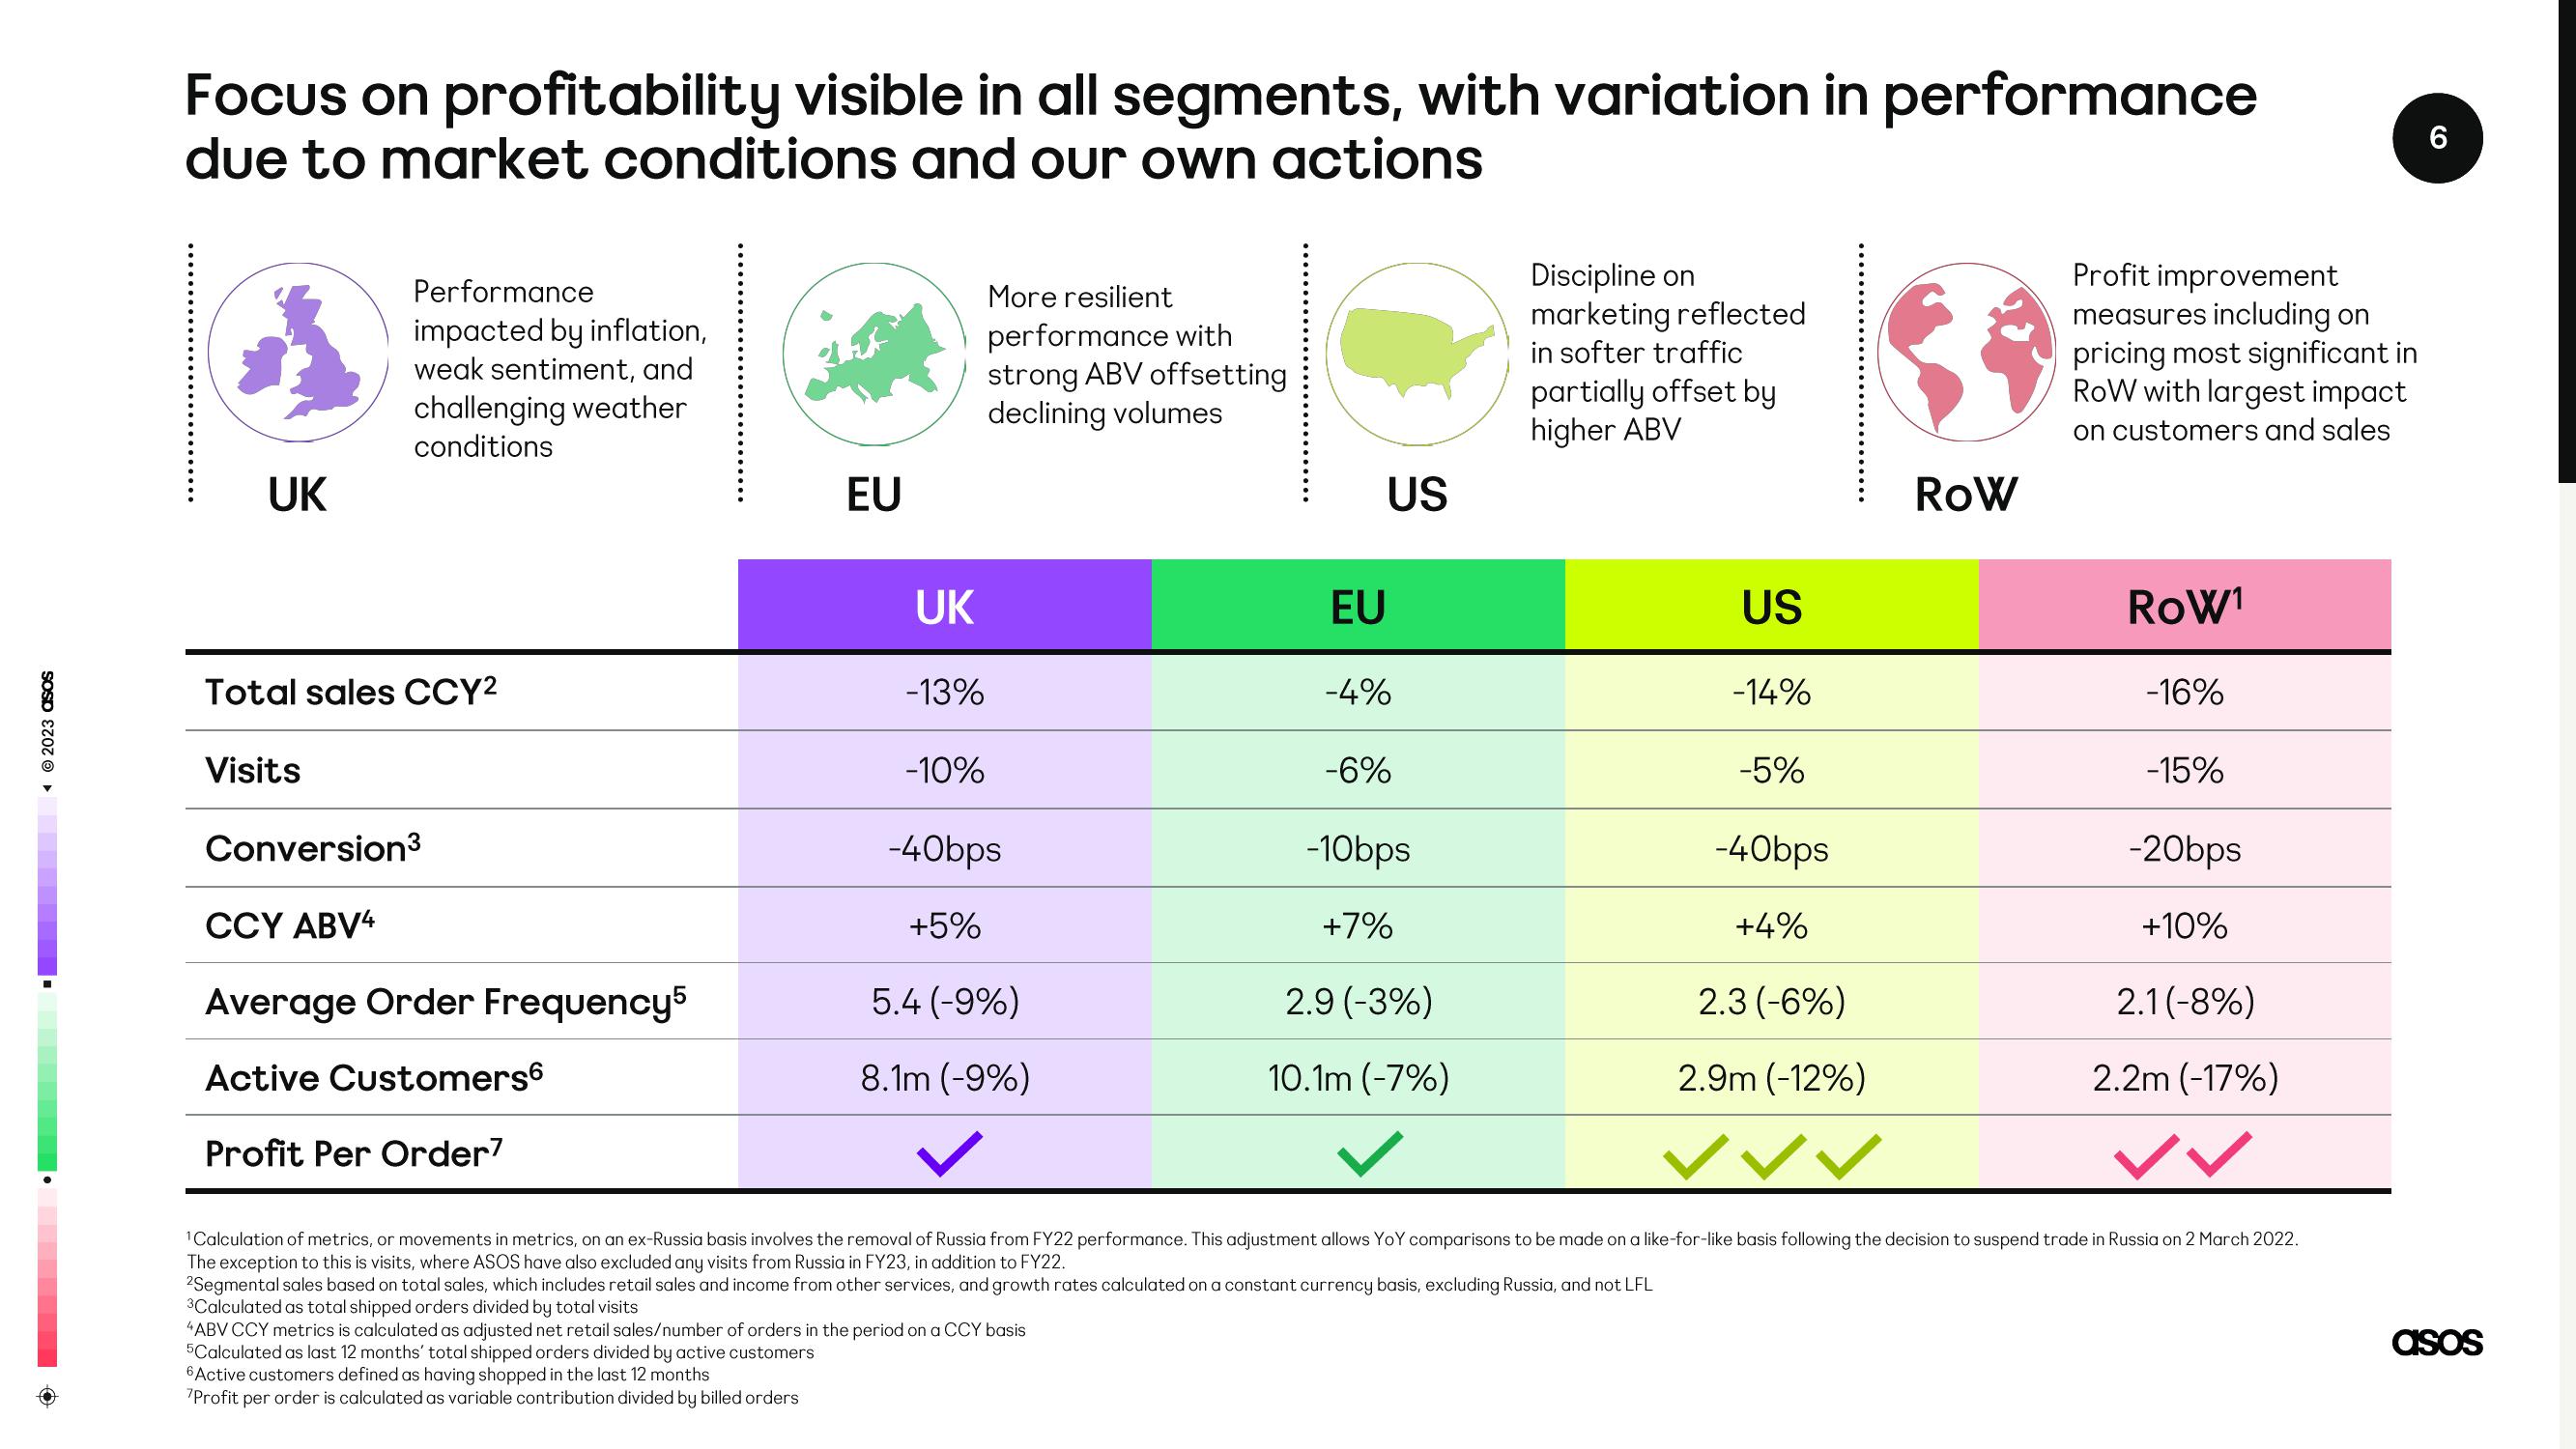
Focus on profitability visible in all segments, with variation in performance
due to market conditions and our own actions
UK
Performance
impacted by inflation,
weak sentiment, and
challenging weather
conditions
Total sales CCY²
Visits
Conversion³
CCY ABV4
Average Order Frequency5
Active Customers6
Profit Per Order7
EU
UK
-13%
-10%
More resilient
performance with
strong ABV offsetting
declining volumes
-40bps
+5%
5.4 (-9%)
8.1m (-9%)
EU
US
-4%
-6%
-10bps
+7%
2.9 (-3%)
10.1m (-7%)
Discipline on
marketing reflected
in softer traffic
partially offset by
higher ABV
US
-14%
-5%
-40bps
+4%
2.3 (-6%)
2.9m (-12%)
✓✓
ROW
Profit improvement
measures including on
pricing most significant in
ROW with largest impact
on customers and sales
ROW¹
-16%
-15%
-20bps
+10%
2.1 (-8%)
2.2m (-17%)
¹Calculation of metrics, or movements in metrics, on an ex-Russia basis involves the removal of Russia from FY22 performance. This adjustment allows YoY comparisons to be made on a like-for-like basis following the decision to suspend trade in Russia on 2 March 2022.
The exception to this is visits, where ASOS have also excluded any visits from Russia in FY23, in addition to FY22.
2Segmental sales based on total sales, which includes retail sales and income from other services, and growth rates calculated on a constant currency basis, excluding Russia, and not LFL
³Calculated as total shipped orders divided by total visits
"ABV CCY metrics is calculated as adjusted net retail sales/number of orders in the period on a CCY basis
5Calculated as last 12 months' total shipped orders divided by active customers
6Active customers defined as having shopped in the last 12 months
7Profit per order is calculated as variable contribution divided by billed orders
6
asosView entire presentation