Paya SPAC Presentation Deck
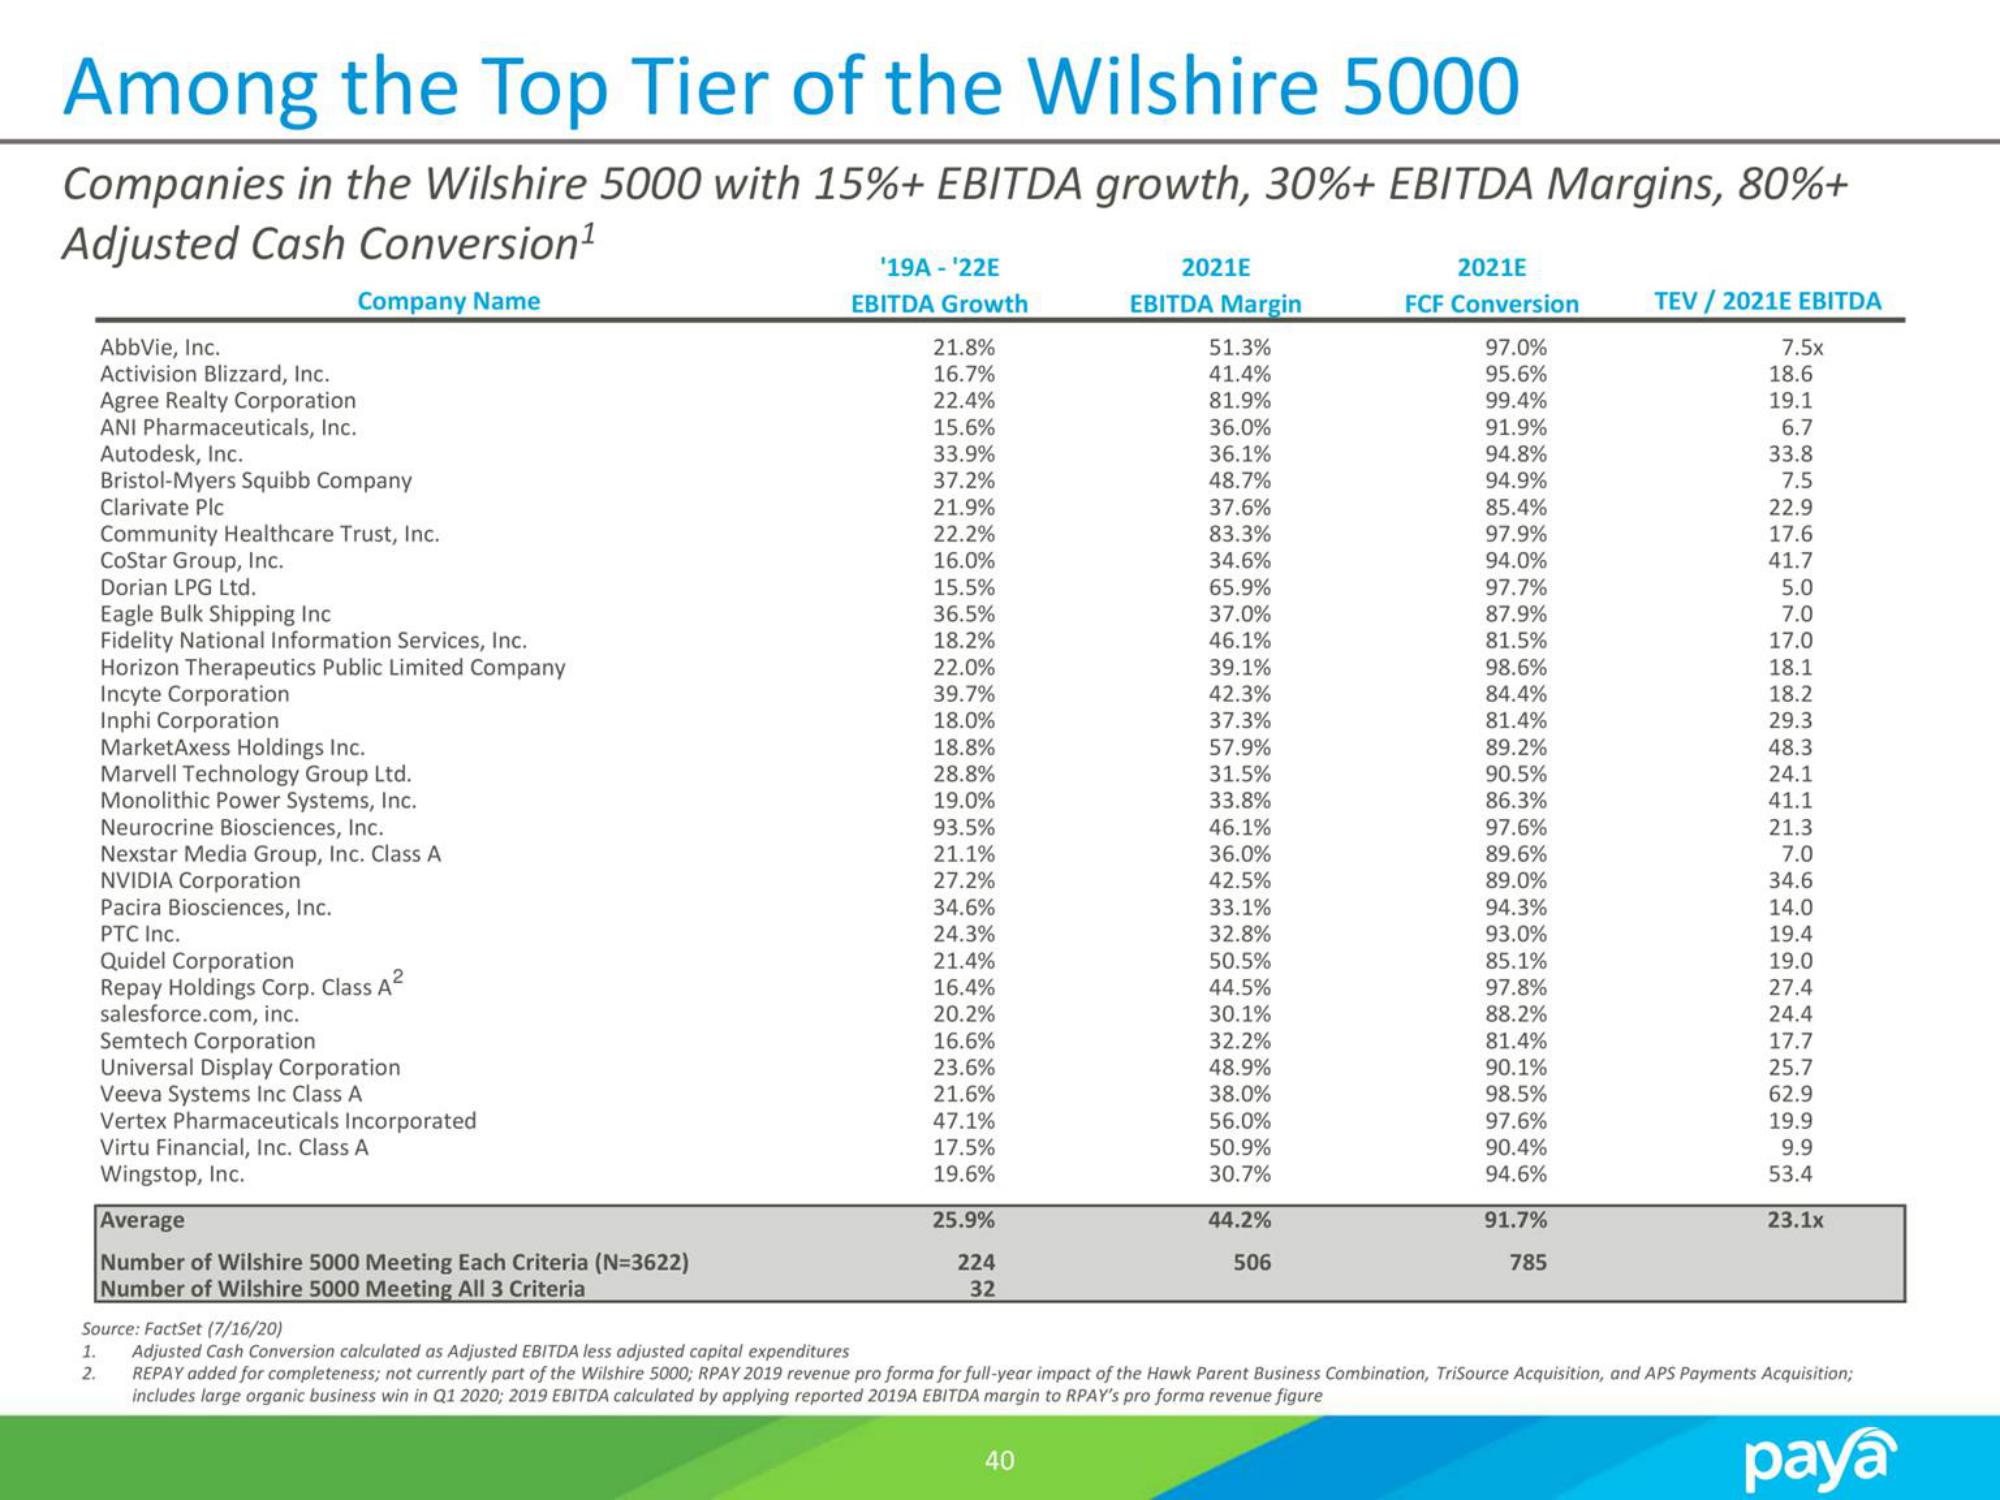
Among the Top Tier of the Wilshire 5000
Companies in the Wilshire 5000 with 15%+ EBITDA growth, 30%+ EBITDA Margins, 80%+
Adjusted Cash Conversion¹
Company Name
AbbVie, Inc.
Activision Blizzard, Inc.
Agree Realty Corporation
ANI Pharmaceuticals, Inc.
Autodesk, Inc.
Bristol-Myers Squibb Company
Clarivate Plc
Community Healthcare Trust, Inc.
CoStar Group, Inc.
Dorian LPG Ltd.
1.
2.
Eagle Bulk Shipping Inc
Fidelity National Information Services, Inc.
Horizon Therapeutics Public Limited Company
Incyte Corporation
Inphi Corporation
MarketAxess Holdings Inc.
Marvell Technology Group Ltd.
Monolithic Power Systems, Inc.
Neurocrine Biosciences, Inc.
Nexstar Media Group, Inc. Class A
NVIDIA Corporation
Pacira Biosciences, Inc.
PTC Inc.
Quidel Corporation
Repay Holdings Corp. Class A²
salesforce.com, inc.
Semtech Corporation
Universal Display Corporation
Veeva Systems Inc Class A
Vertex Pharmaceuticals Incorporated
Virtu Financial, Inc. Class A
Wingstop, Inc.
Average
Number of Wilshire 5000 Meeting Each Criteria (N=3622)
Number of Wilshire 5000 Meeting All 3 Criteria
'19A-¹22E
EBITDA Growth
21.8%
16.7%
22.4%
15.6%
33.9%
37.2%
21.9%
22.2%
16.0%
15.5%
36.5%
18.2%
22.0%
39.7%
18.0%
18.8%
28.8%
19.0%
93.5%
21.1%
27.2%
34.6%
24.3%
21.4%
16.4%
20.2%
16.6%
23.6%
21.6%
47.1%
17.5%
19.6%
25.9%
224
32
2021E
40
EBITDA Margin
51.3%
41.4%
81.9%
36.0%
36.1%
48.7%
37.6%
83.3%
34.6%
65.9%
37.0%
46.1%
39.1%
42.3%
37.3%
57.9%
31.5%
33.8%
46.1%
36.0%
42.5%
33.1%
32.8%
50.5%
44.5%
30.1%
32.2%
48.9%
38.0%
56.0%
50.9%
30.7%
44.2%
506
2021E
FCF Conversion
97.0%
95.6%
99.4%
91.9%
94.8%
94.9%
85.4%
97.9%
94.0%
97.7%
87.9%
81.5%
98.6%
84.4%
81.4%
89.2%
90.5%
86.3%
97.6%
89.6%
89.0%
94.3%
93.0%
85.1%
97.8%
88.2%
81.4%
90.1%
98.5%
97.6%
90.4%
94.6%
91.7%
785
TEV / 2021E EBITDA
7.5x
18.6
19.1
6.7
33.8
7.5
22.9
17.6
41.7
5.0
7.0
17.0
18.1
18.2
29.3
48.3
24.1
41.1
21.3
7.0
34.6
14.0
19.4
19.0
27.4
24.4
17.7
25.7
62.9
19.9
9.9
53.4
Source: FactSet (7/16/20)
Adjusted Cash Conversion calculated as Adjusted EBITDA less adjusted capital expenditures
REPAY added for completeness; not currently part of the Wilshire 5000; RPAY 2019 revenue pro forma for full-year impact of the Hawk Parent Business Combination, TriSource Acquisition, and APS Payments Acquisition;
includes large organic business win in Q1 2020; 2019 EBITDA calculated by applying reported 2019A EBITDA margin to RPAY's pro forma revenue figure
paya
23.1xView entire presentation