Evolv SPAC Presentation Deck
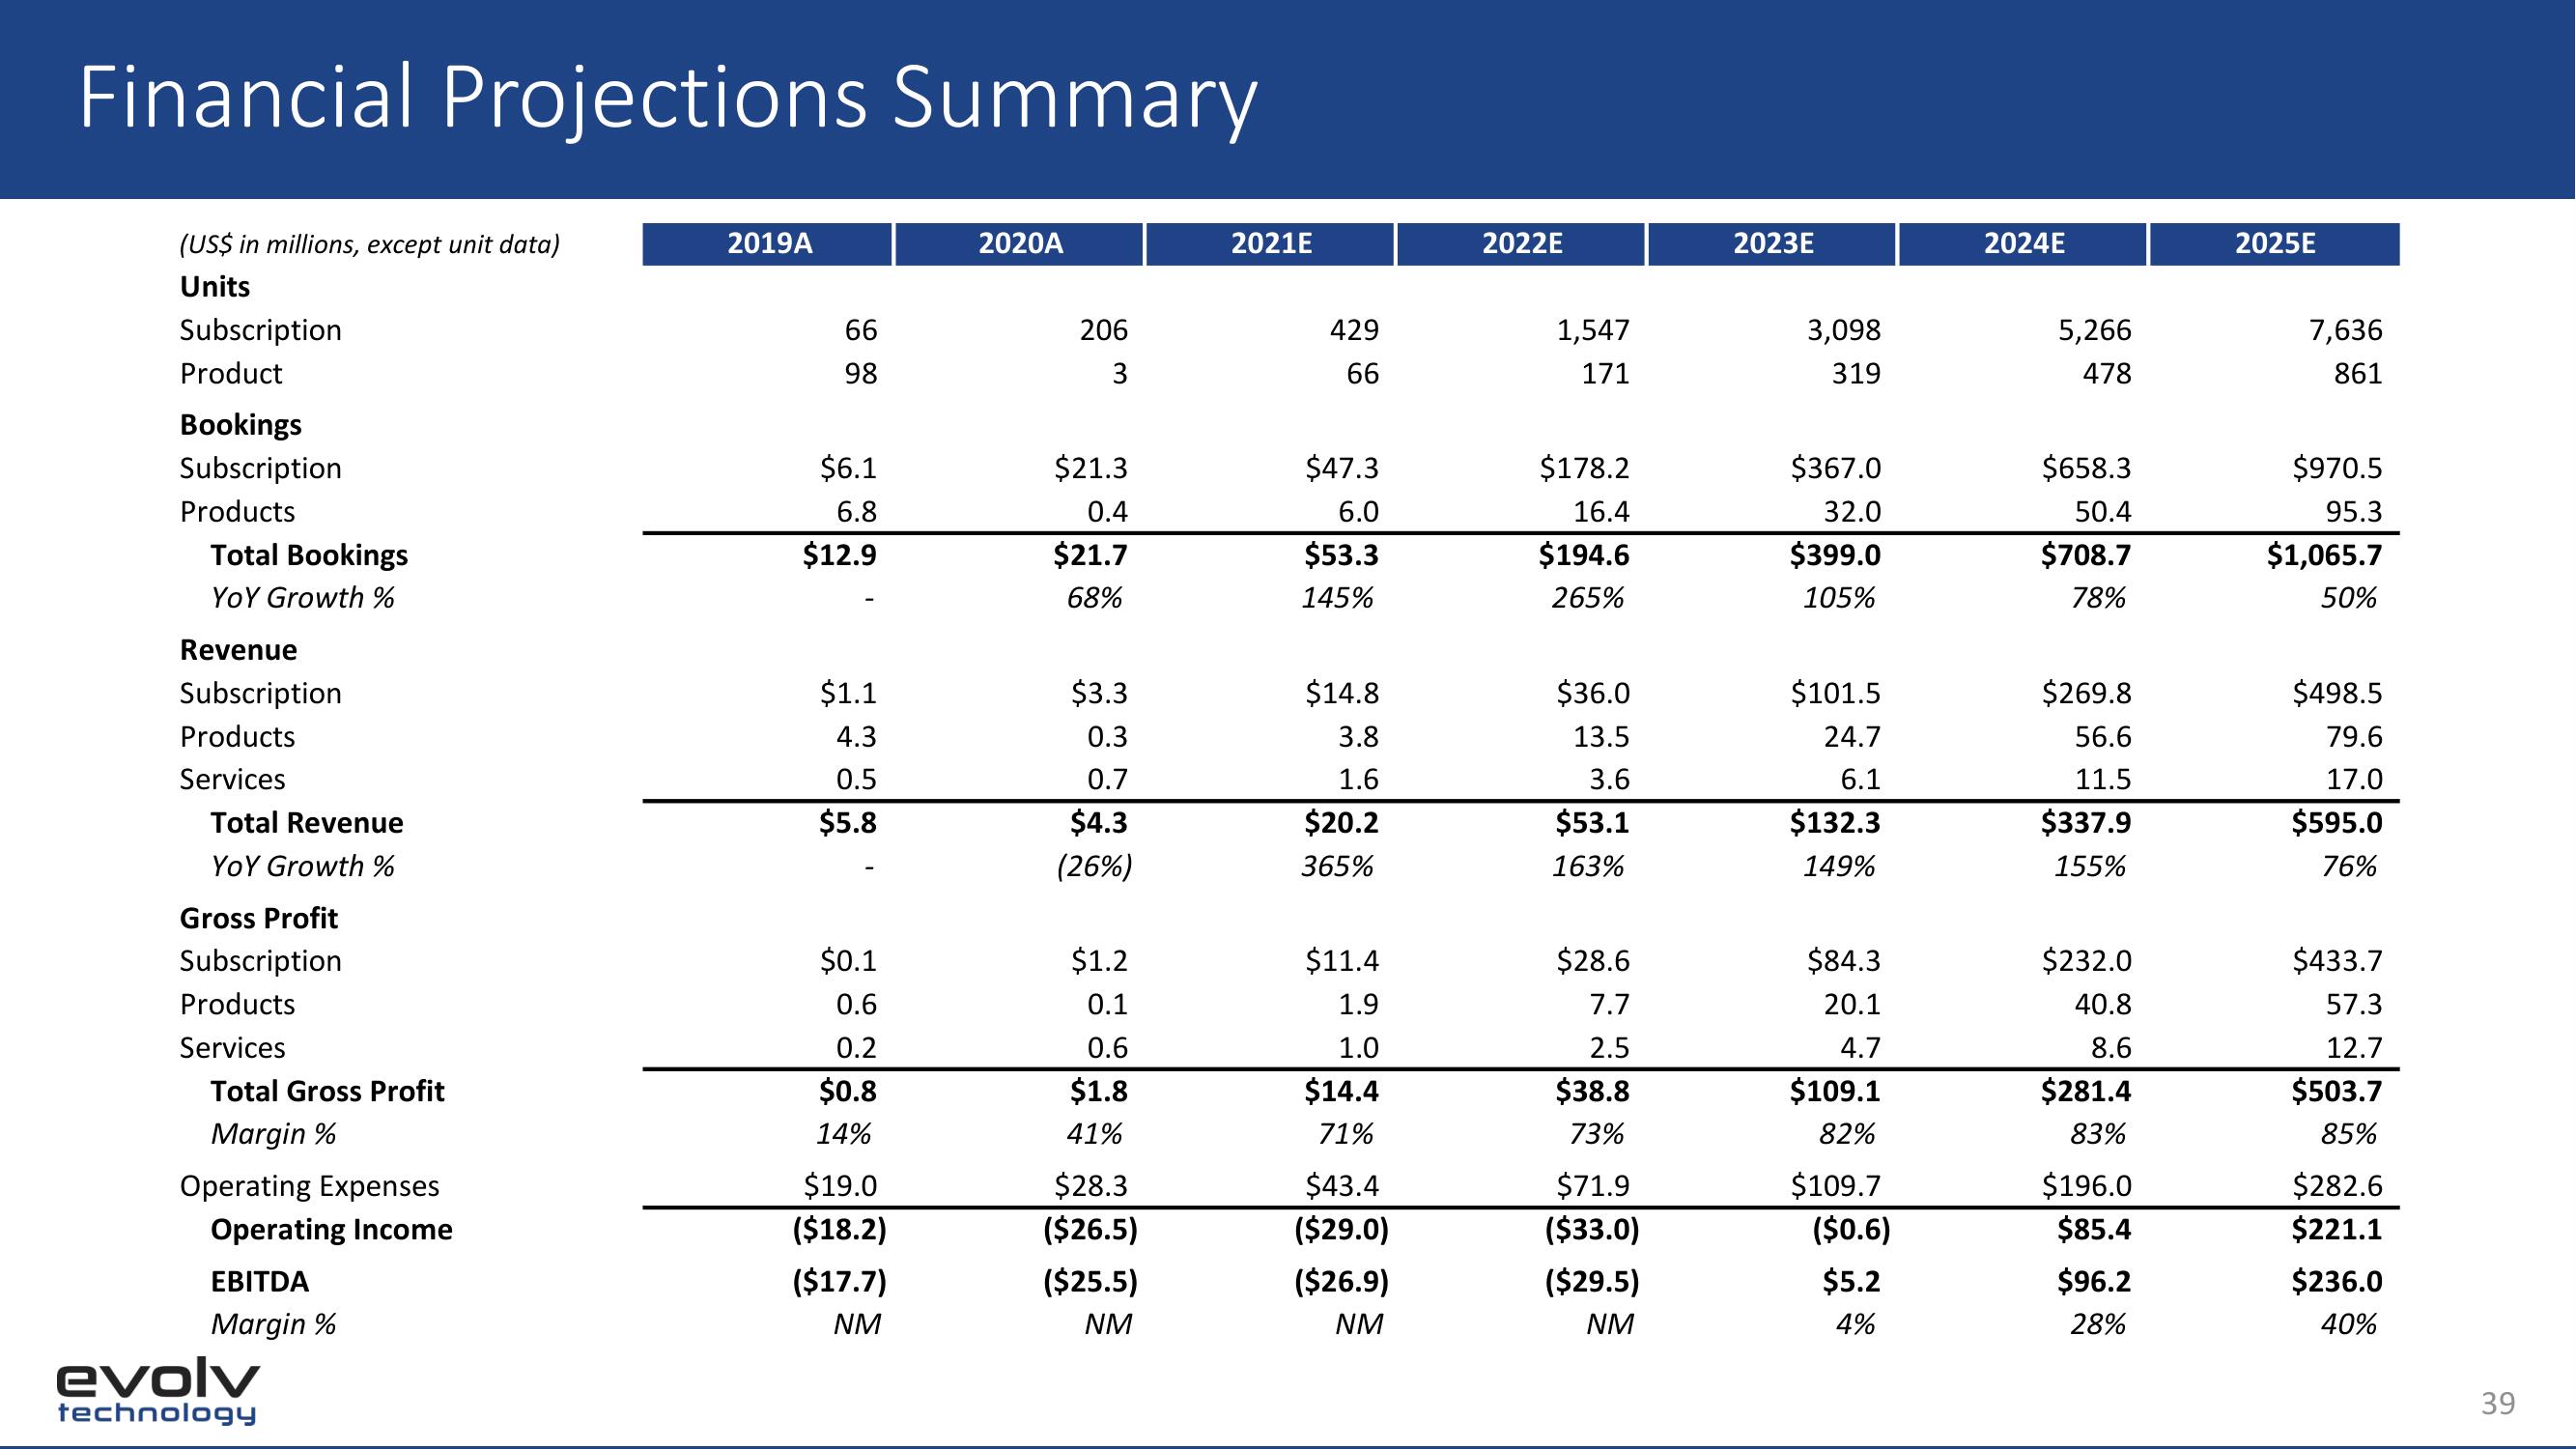
Financial Projections Summary
(US$ in millions, except unit data)
Units
Subscription
Product
Bookings
Subscription
Products
Total Bookings
YOY Growth %
Revenue
Subscription
Products
Services
Total Revenue
YOY Growth %
Gross Profit
Subscription
Products
Services
Total Gross Profit
Margin %
Operating Expenses
Operating Income
EBITDA
Margin %
evolv
technology
2019A
66
98
$6.1
6.8
$12.9
$1.1
4.3
0.5
$5.8
$0.1
0.6
0.2
$0.8
14%
$19.0
($18.2)
($17.7)
NM
2020A
206
3
$21.3
0.4
$21.7
68%
$3.3
0.3
0.7
$4.3
(26%)
$1.2
0.1
0.6
$1.8
41%
$28.3
($26.5)
($25.5)
NM
2021E
429
66
$47.3
6.0
$53.3
145%
$14.8
3.8
1.6
$20.2
365%
$11.4
1.9
1.0
$14.4
71%
$43.4
($29.0)
($26.9)
NM
2022E
1,547
171
$178.2
16.4
$194.6
265%
$36.0
13.5
3.6
$53.1
163%
$28.6
7.7
2.5
$38.8
73%
$71.9
($33.0)
($29.5)
NM
2023E
3,098
319
$367.0
32.0
$399.0
105%
$101.5
24.7
6.1
$132.3
149%
$84.3
20.1
4.7
$109.1
82%
$109.7
($0.6)
$5.2
4%
2024E
5,266
478
$658.3
50.4
$708.7
78%
$269.8
56.6
11.5
$337.9
155%
$232.0
40.8
8.6
$281.4
83%
$196.0
$85.4
$96.2
28%
2025E
7,636
861
$970.5
95.3
$1,065.7
50%
$498.5
79.6
17.0
$595.0
76%
$433.7
57.3
12.7
$503.7
85%
$282.6
$221.1
$236.0
40%
39View entire presentation