Wix Results Presentation Deck
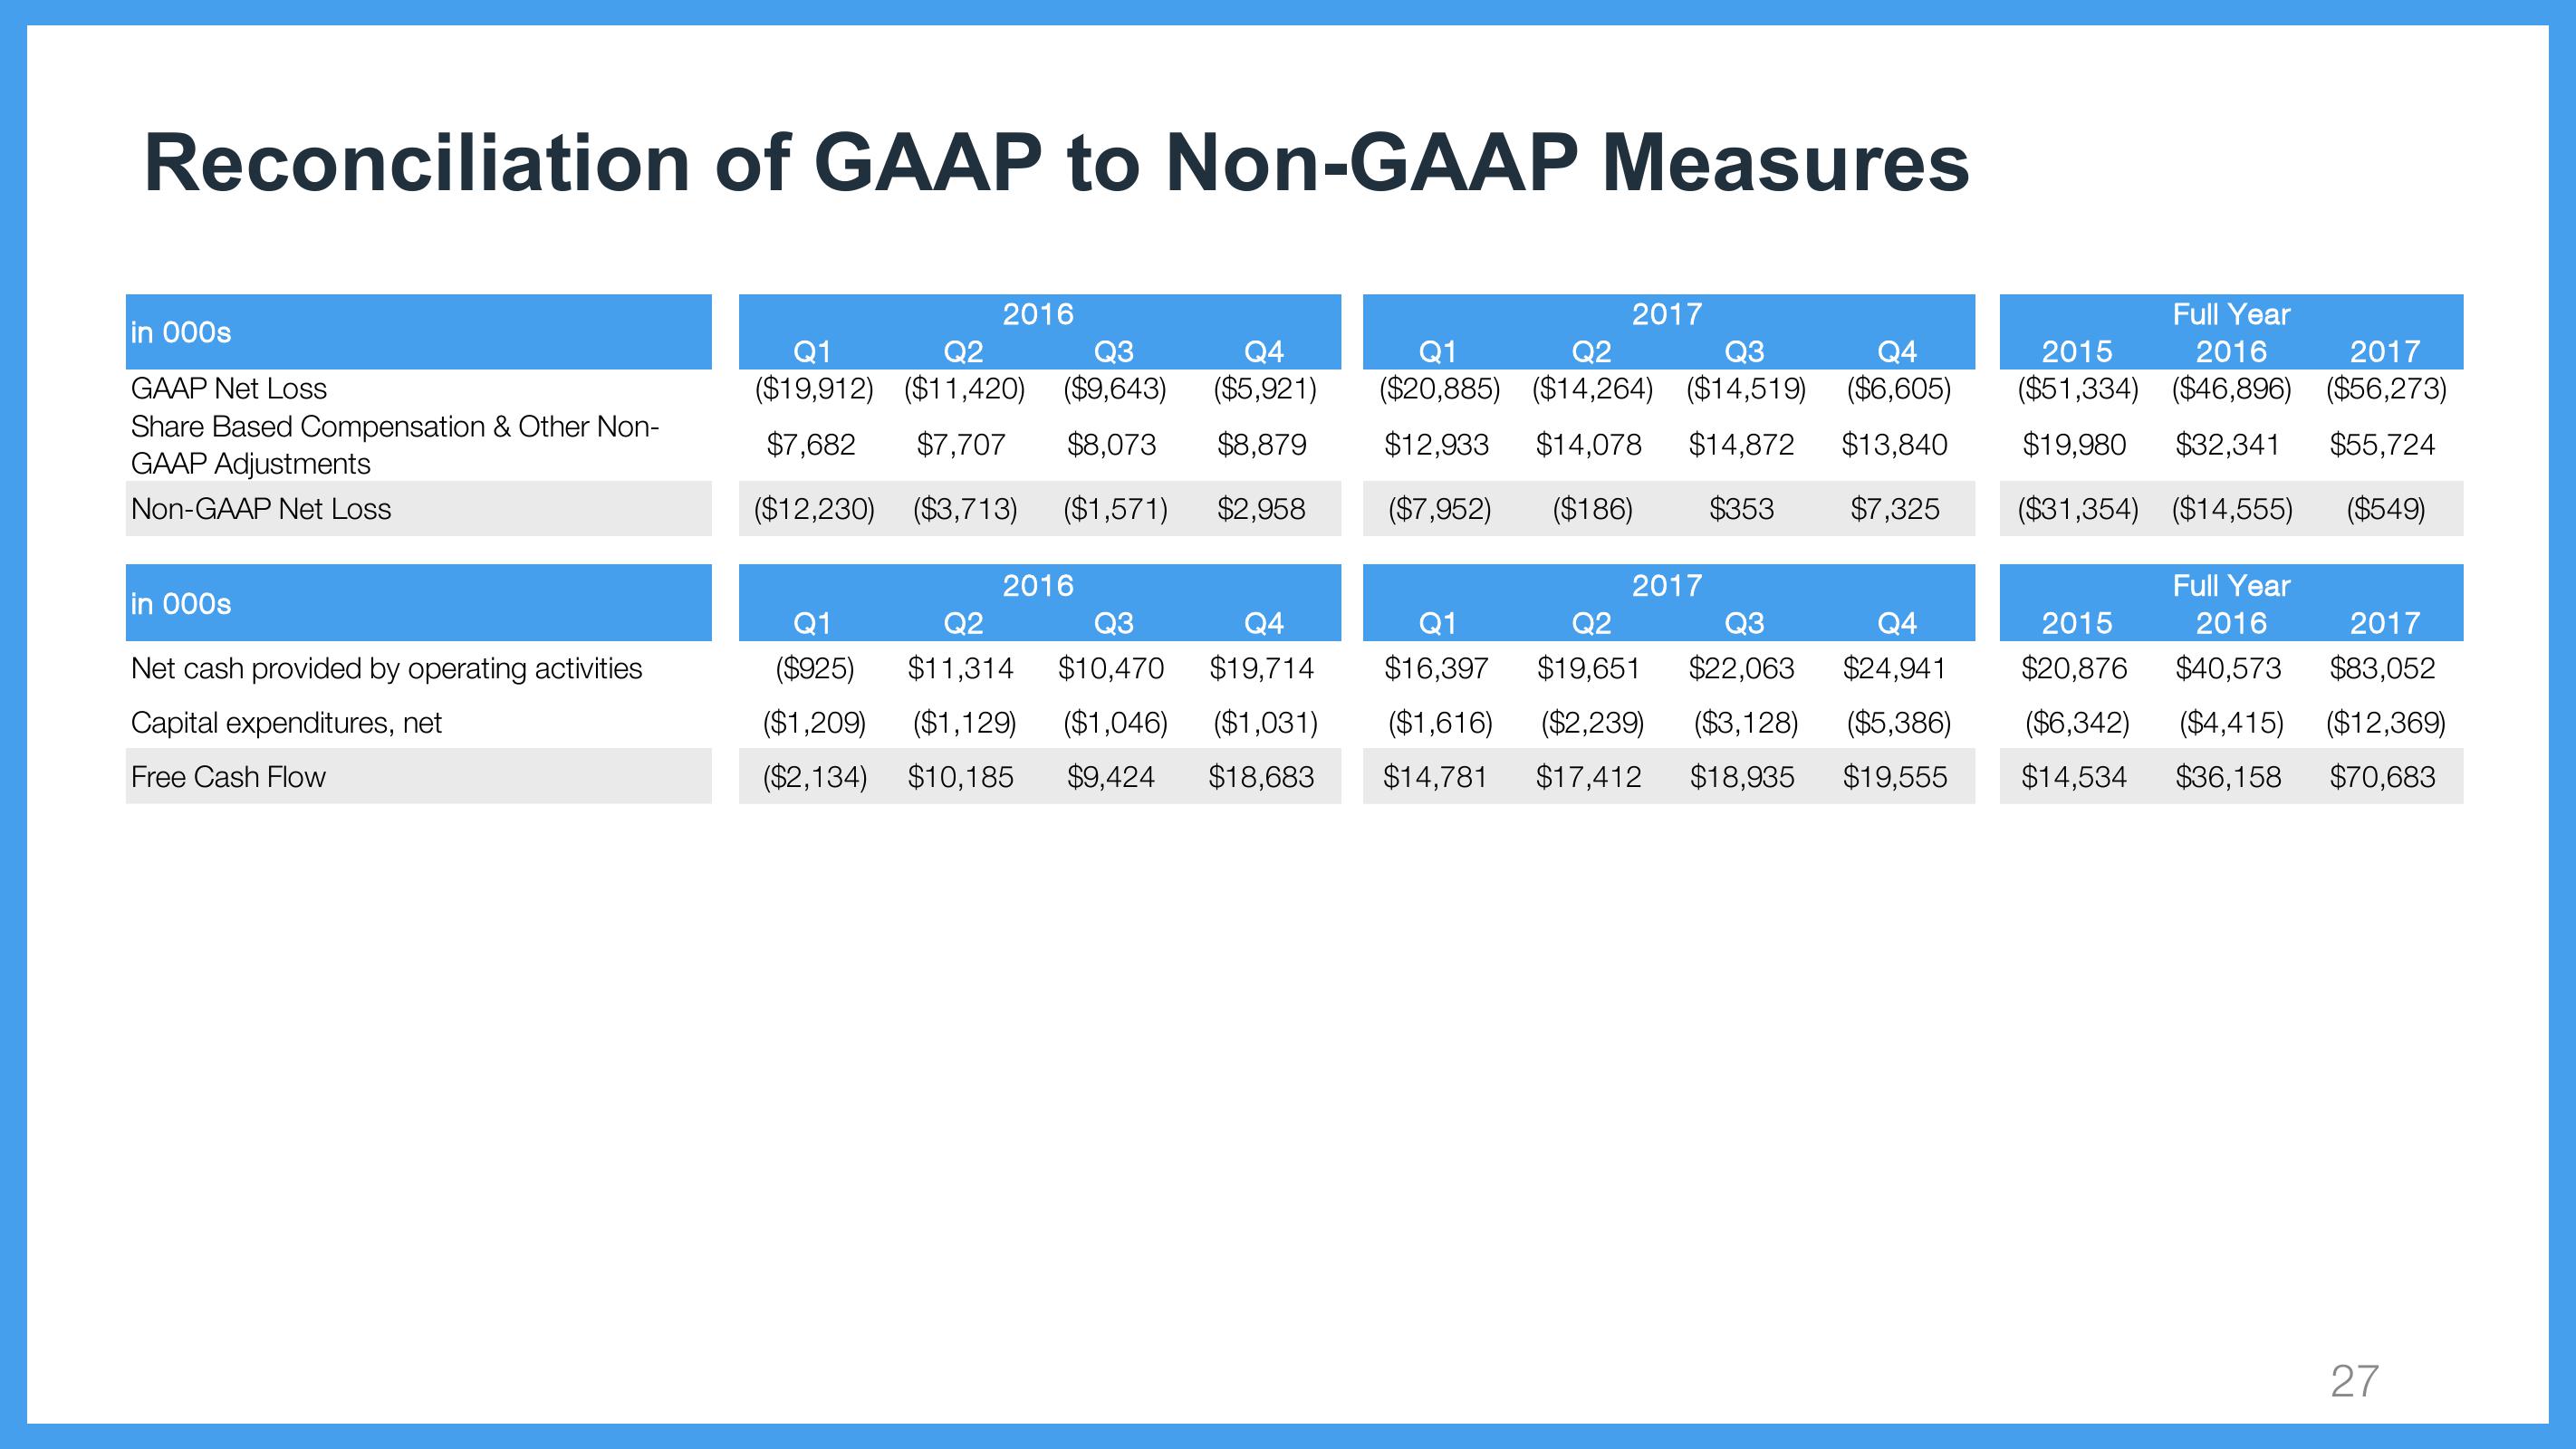
Reconciliation of GAAP to Non-GAAP Measures
in 000s
GAAP Net Loss
Share Based Compensation & Other Non-
GAAP Adjustments
Non-GAAP Net Loss
in 000s
Net cash provided by operating activities
Capital expenditures, net
Free Cash Flow
2016
Q1
Q2
Q3
($19,912) ($11,420) ($9,643)
$7,682 $7,707 $8,073
($12,230) ($3,713) ($1,571)
2016
2017
Q1
Q2
Q3
Q4
Q4
($5,921) ($20,885) ($14,264) ($14,519) ($6,605)
$12,933 $14,078 $14,872 $13,840
($7,952) ($186) $353 $7,325
$8,879
$2,958
Q1
Q2
Q3
Q4
($925) $11,314 $10,470 $19,714
($1,209) ($1,129) ($1,046) ($1,031)
($2,134) $10,185 $9,424 $18,683
2017
Q1
Q2
Q3
Q4
$16,397 $19,651 $22,063 $24,941
($1,616) ($2,239) ($3,128) ($5,386)
$14,781 $17,412 $18,935 $19,555
Full Year
2015 2016 2017
($51,334) ($46,896) ($56,273)
$19,980 $32,341 $55,724
($549)
($31,354) ($14,555)
Full Year
2015 2016 2017
$20,876 $40,573 $83,052
($6,342) ($4,415) ($12,369)
$14,534 $36,158 $70,683
27View entire presentation