Dutch Bros Results Presentation Deck
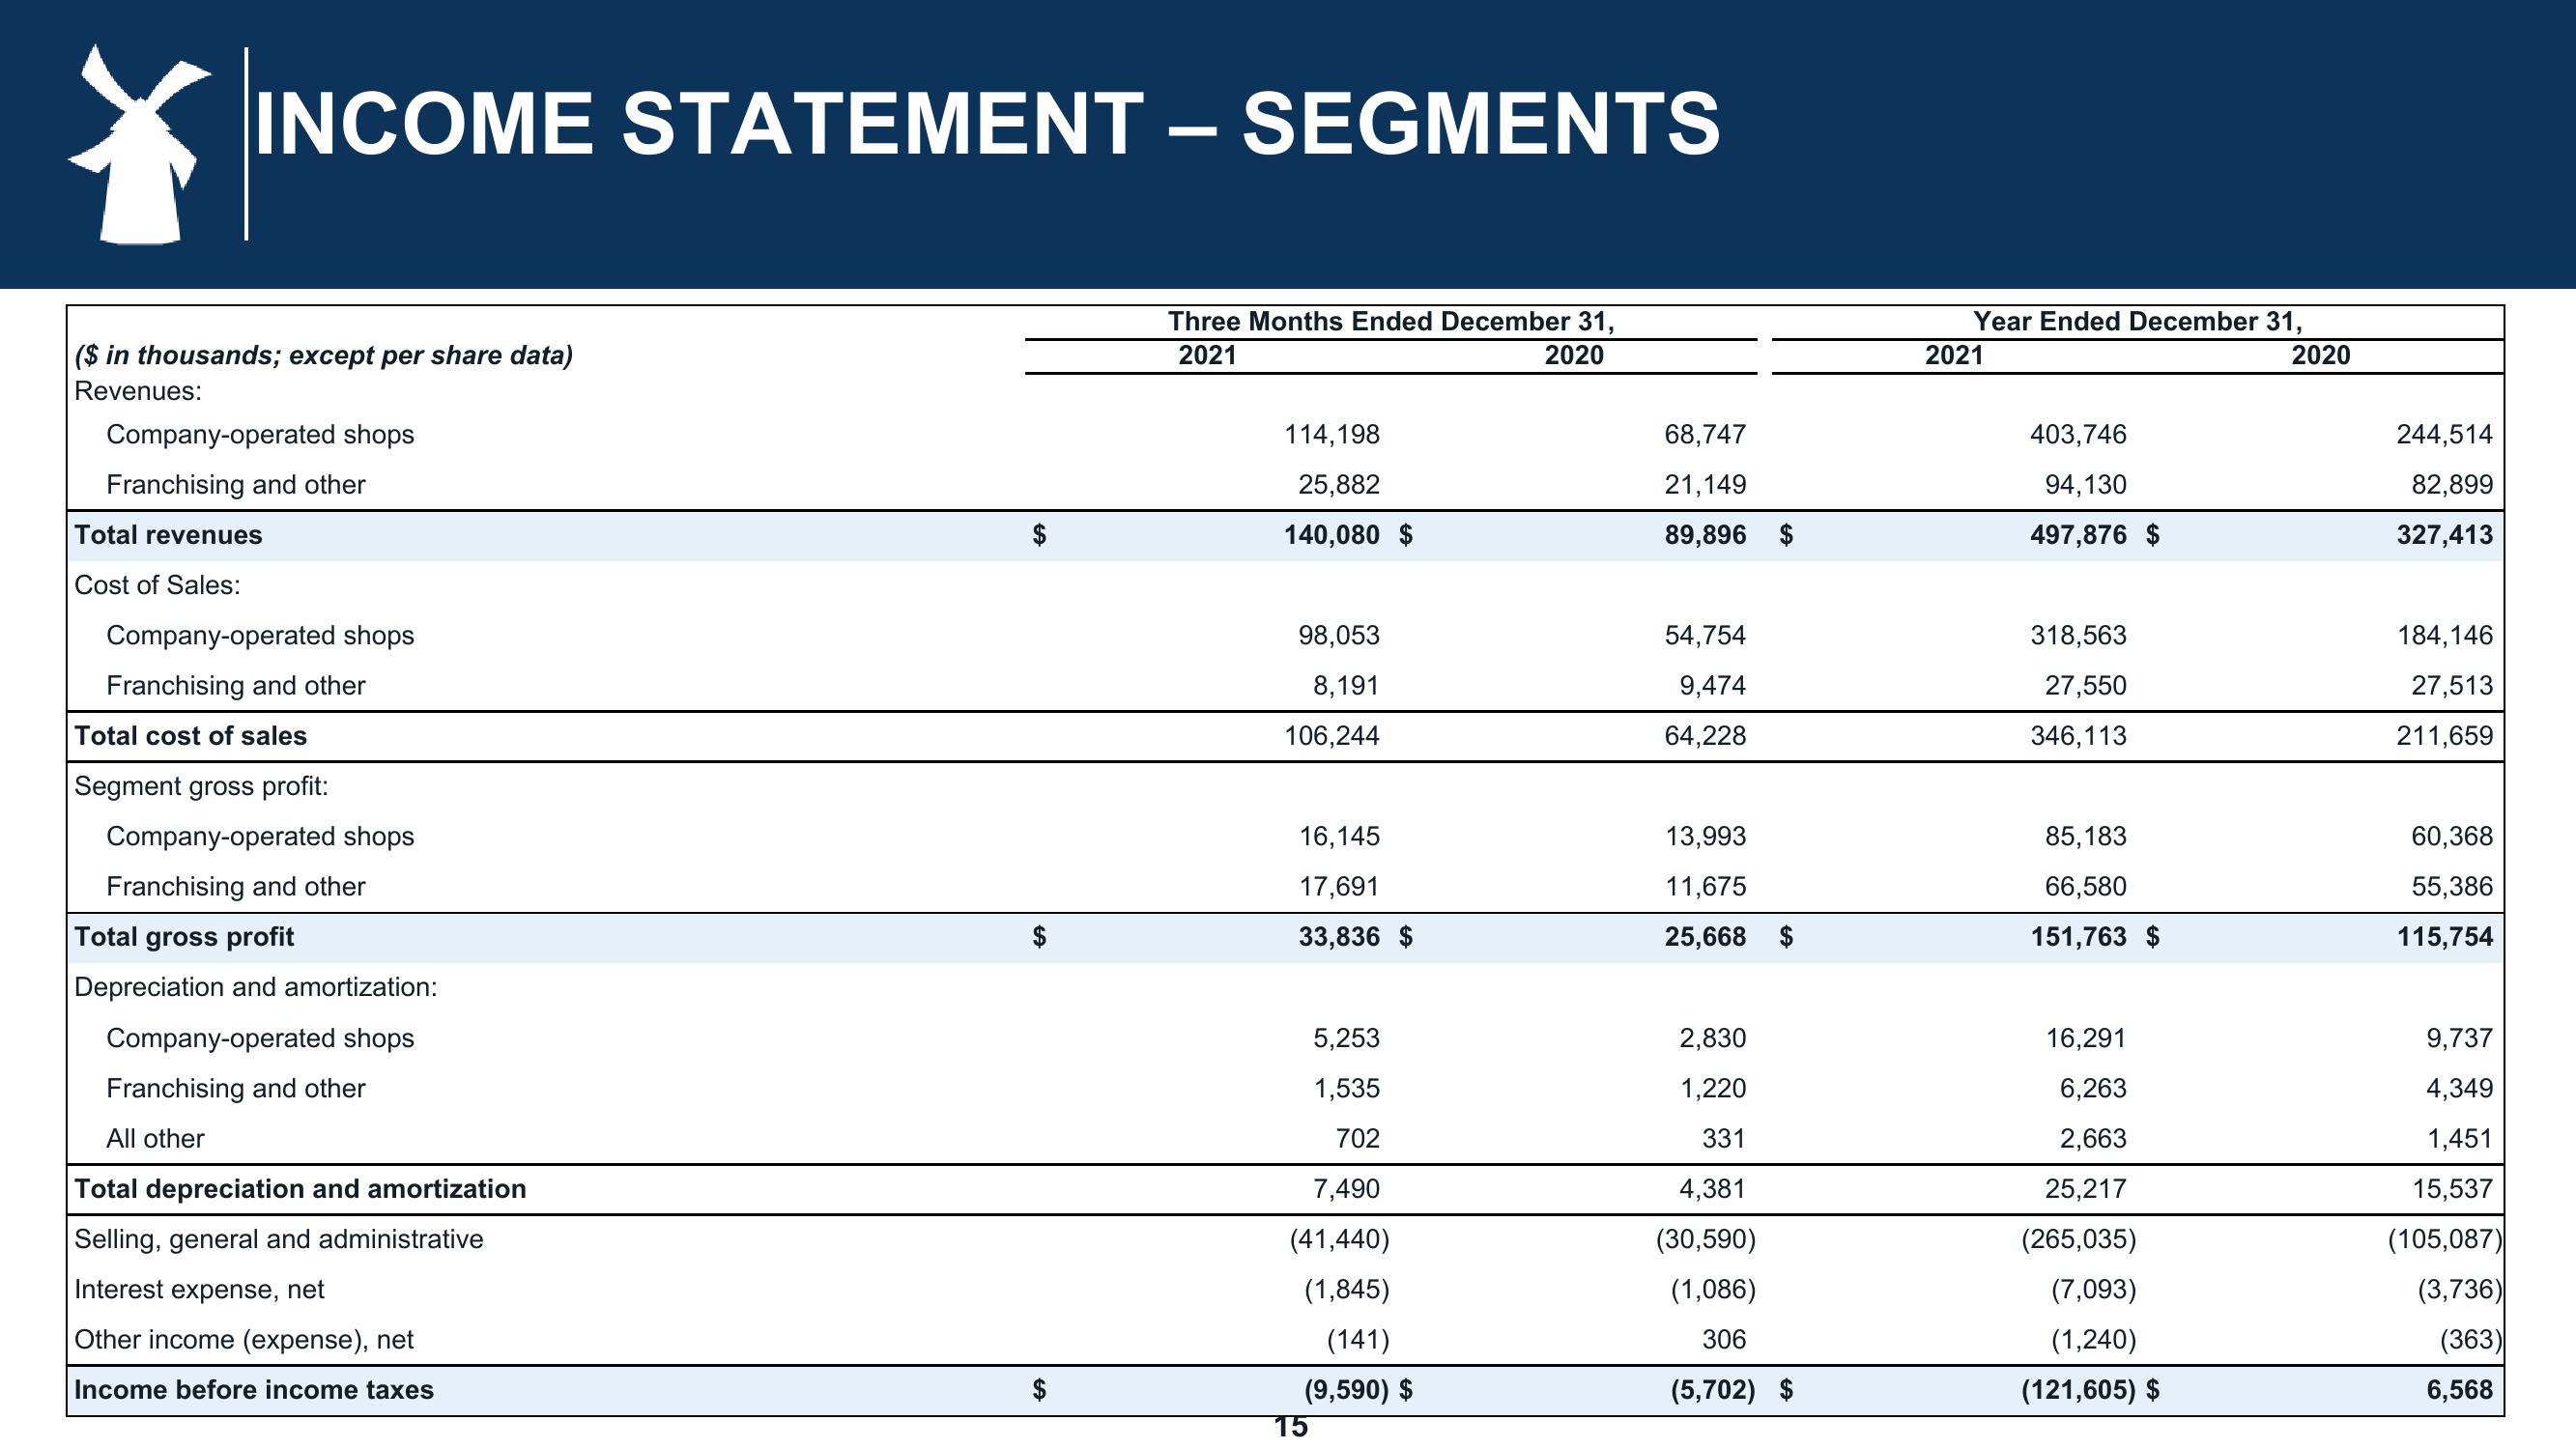
INCOME STATEMENT - SEGMENTS
($ in thousands; except per share data)
Revenues:
Company-operated shops
Franchising and other
Total revenues
Cost of Sales:
Company-operated shops
Franchising and other
Total cost of sales
Segment gross profit:
Company-operated shops
Franchising and other
Total gross profit
Depreciation and amortization:
Company-operated shops
Franchising and other
All other
Total depreciation and amortization
Selling, general and administrative
Interest expense, net
Other income (expense), net
Income before income taxes
LA
SA
SA
Three Months Ended December 31,
2021
2020
114,198
25,882
140,080 $
98,053
8,191
106,244
16,145
17,691
33,836 $
5,253
1,535
702
7,490
(41,440)
(1,845)
(141)
(9,590) $
15
68,747
21,149
89,896 $
54,754
9,474
64,228
13,993
11,675
25,668 $
2,830
1,220
331
4,381
(30,590)
(1,086)
306
(5,702)
Year Ended December 31,
2021
403,746
94,130
497,876 $
318,563
27,550
346,113
85,183
66,580
151,763 $
16,291
6,263
2,663
25,217
(265,035)
(7,093)
(1,240)
(121,605) $
2020
244,514
82,899
327,413
184,146
27,513
211,659
60,368
55,386
115,754
9,737
4,349
1,451
15,537
(105,087)
(3,736)
(363)
6,568View entire presentation