Investor Presentation
-
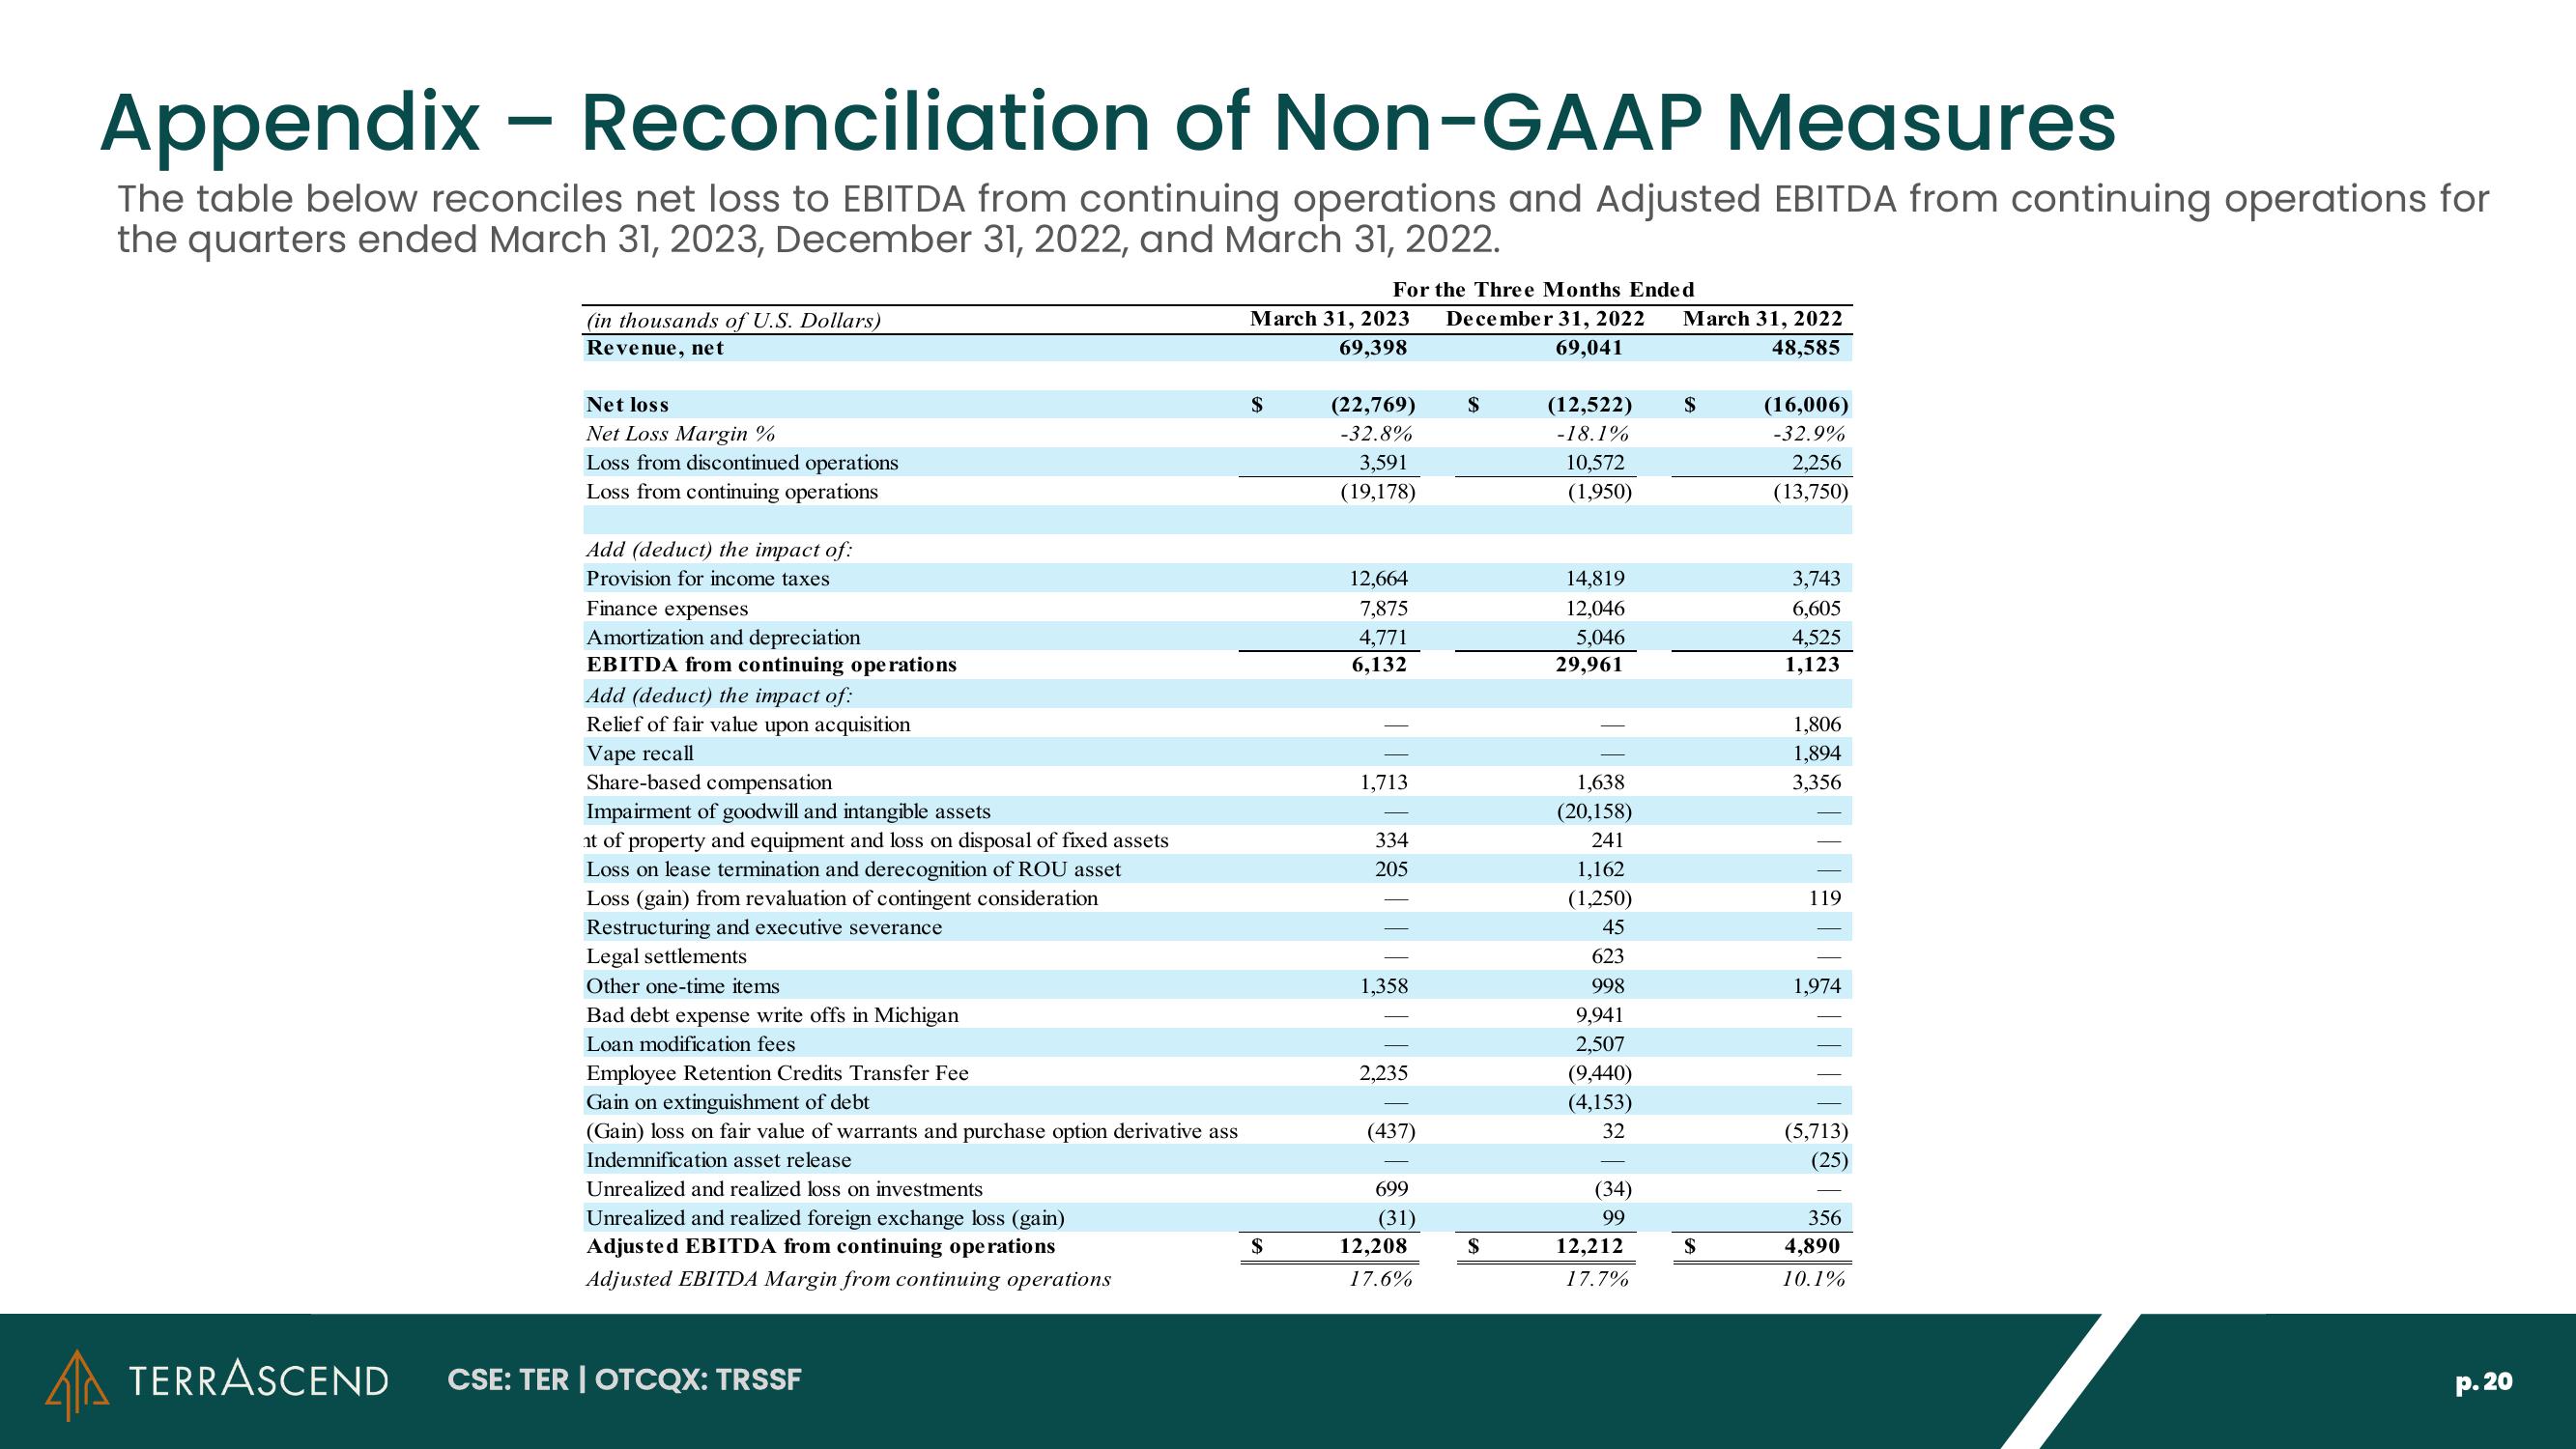
Appendix - Reconciliation of Non-GAAP Measures
The table below reconciles net loss to EBITDA from continuing operations and Adjusted EBITDA from continuing operations for
the quarters ended March 31, 2023, December 31, 2022, and March 31, 2022.
4 TERRASCEND
(in thousands of U.S. Dollars)
Revenue, net
Net loss
Net Loss Margin %
Loss from discontinued operations
Loss from continuing operations
Add (deduct) the impact of:
Provision for income taxes
Finance expenses
Amortization and depreciation
EBITDA from continuing operations
Add (deduct) the impact of:
Relief of fair value upon acquisition
Vape recall
Share-based compensation
Impairment of goodwill and intangible assets
nt of property and equipment and loss on disposal of fixed assets
Loss on lease termination and derecognition of ROU asset
Loss (gain) from revaluation of contingent consideration
Restructuring and executive severance
Legal settlements
Other one-time items
Bad debt expense write offs in Michigan
Loan modification fees
Employee Retention Credits Transfer Fee
Gain on extinguishment of debt
(Gain) loss on fair value of warrants and purchase option derivative ass
Indemnification asset release
Unrealized and realized loss on investments
Unrealized and realized foreign exchange loss (gain)
Adjusted EBITDA from continuing operations
Adjusted EBITDA Margin from continuing operations
CSE: TER | OTCQX: TRSSF
For the Three Months Ended
March 31, 2023 December 31, 2022 March 31, 2022
69,398
69,041
48,585
$
(22,769)
-32.8%
3,591
(19,178)
12,664
7,875
4,771
6,132
1,713
334
205
1,358
2,235
(437)
699
(31)
12,208
17.6%
$
(12,522)
-18.1%
10,572
(1,950)
14,819
12,046
5,046
29,961
1,638
(20,158)
241
1,162
(1,250)
45
623
998
9,941
2,507
(9,440)
(4,153)
32
(34)
99
12,212
17.7%
$
$
(16,006)
-32.9%
2,256
(13,750)
3,743
6,605
4,525
1,123
1,806
1,894
3,356
119
1,974
(5,713)
(25)
356
4,890
10.1%
p.20View entire presentation