First Quarter 2017 Financial Review
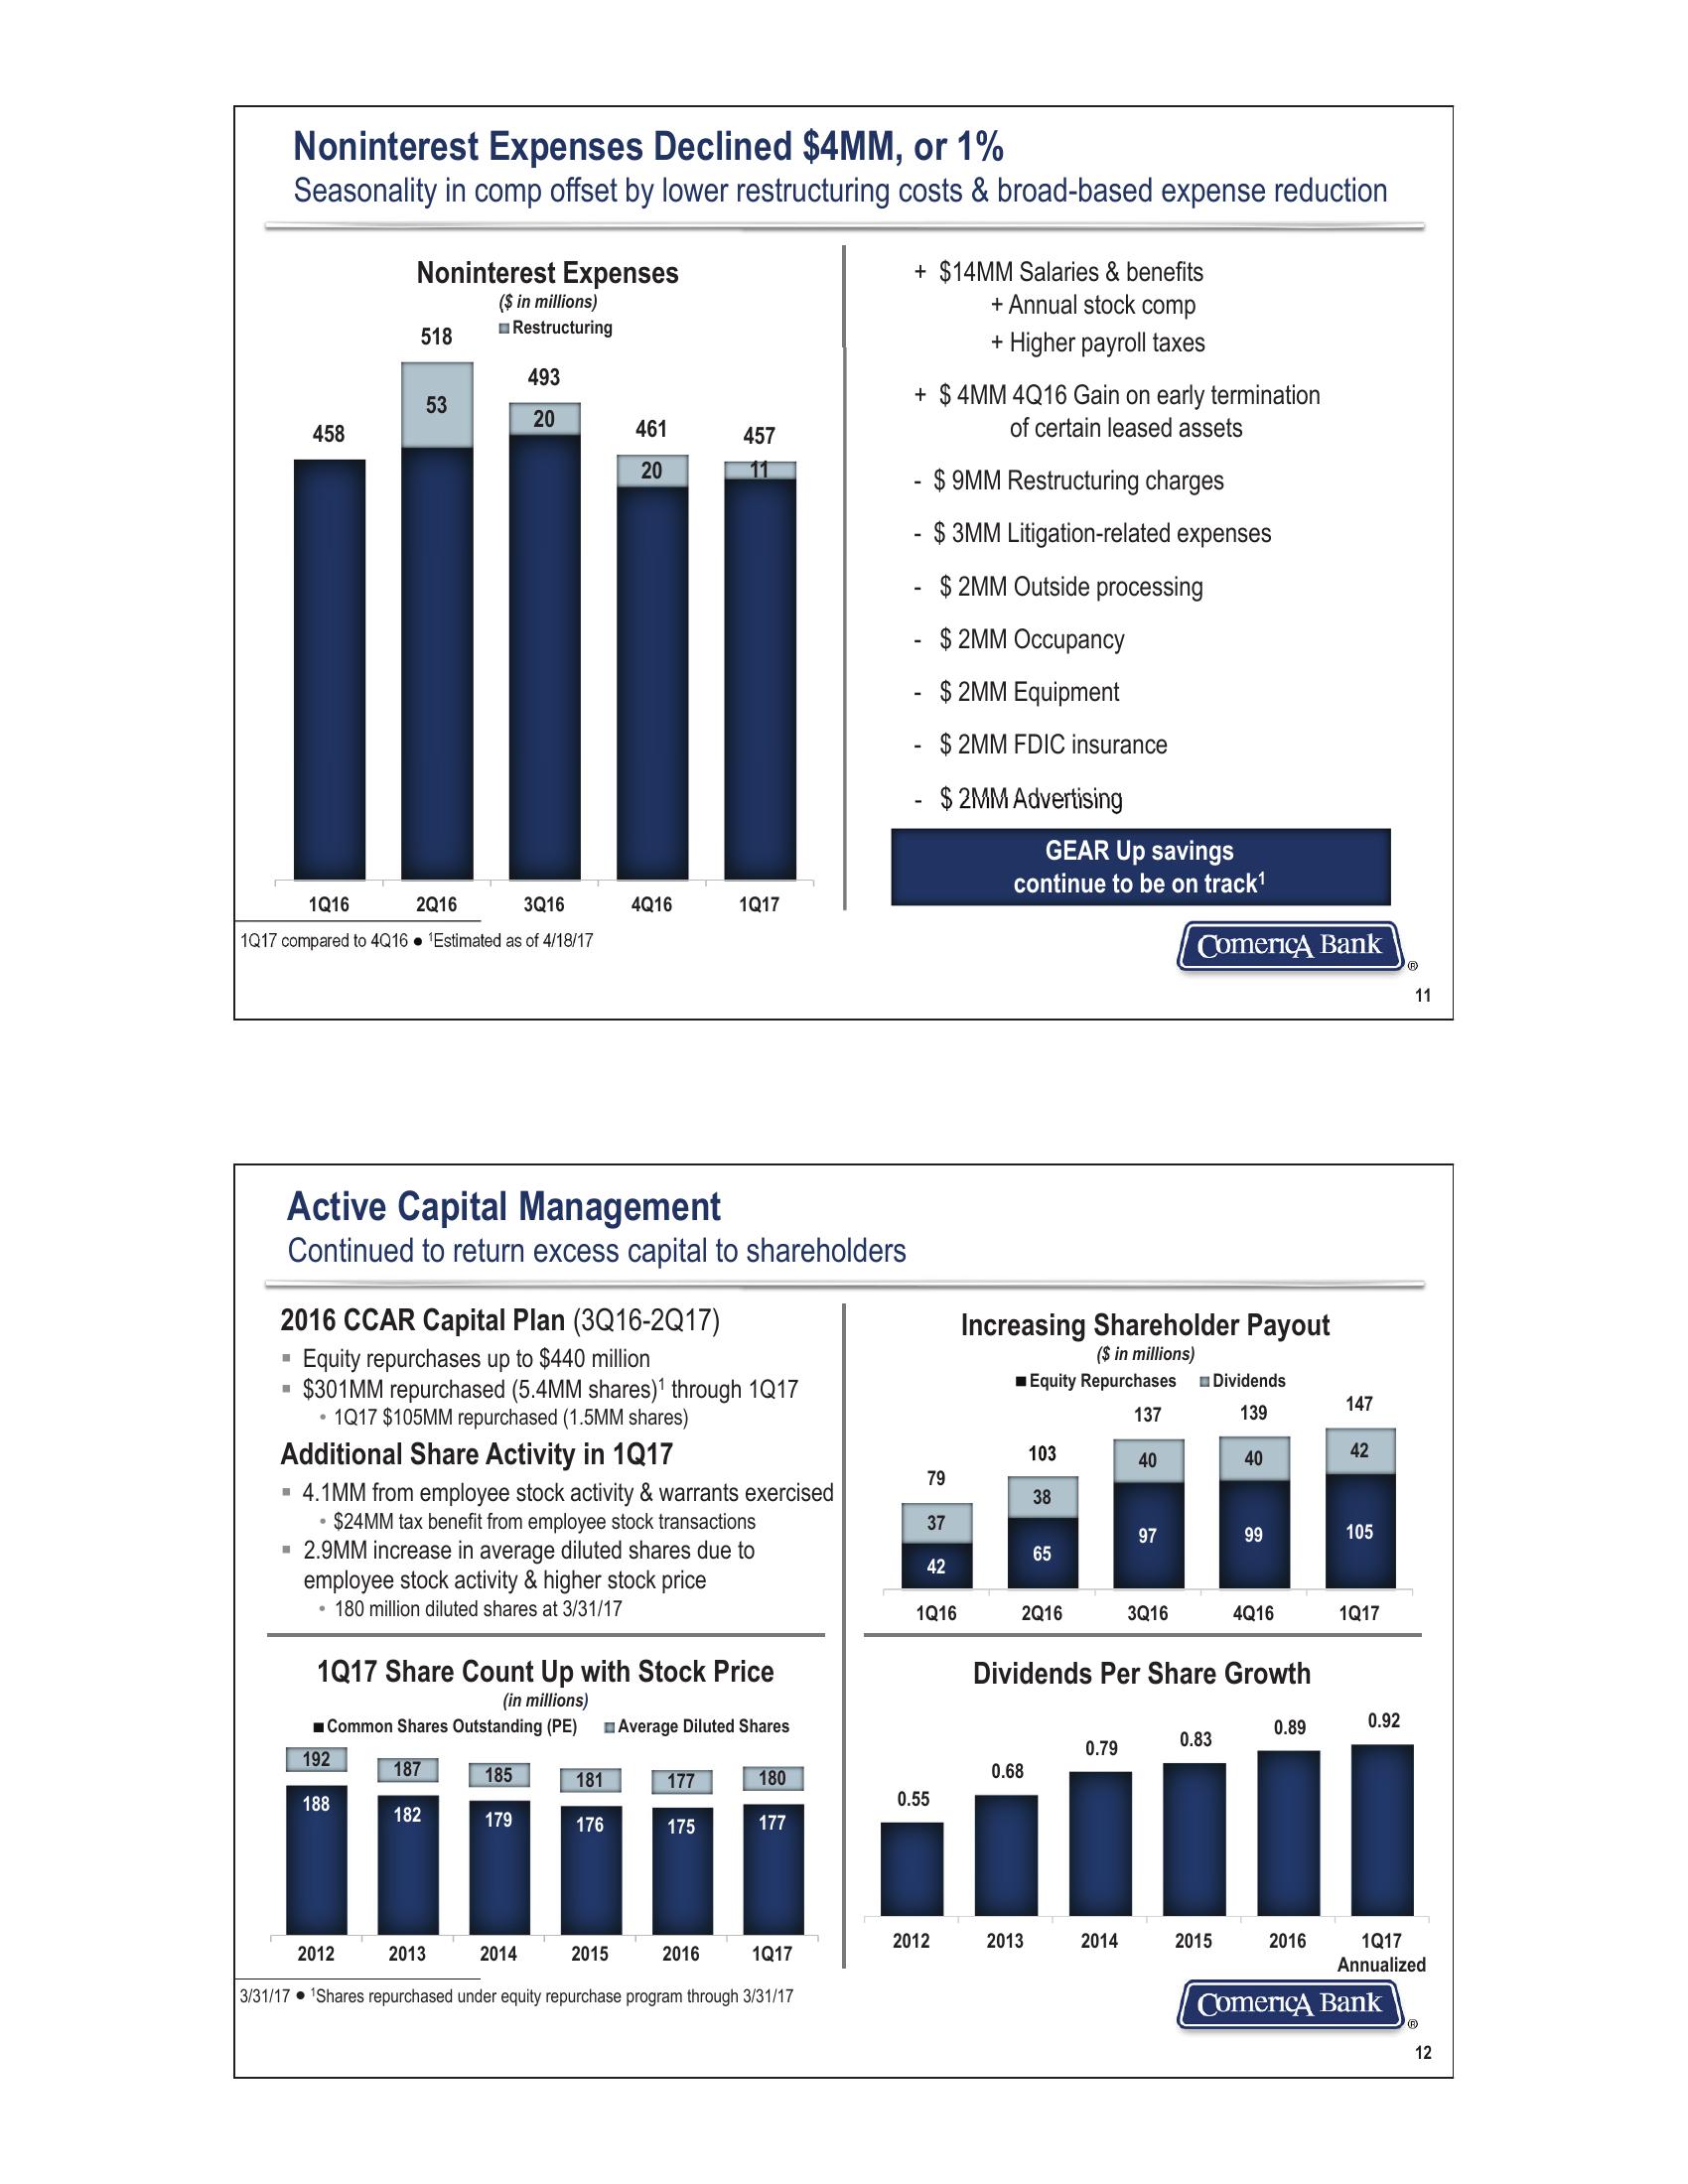
Noninterest Expenses Declined $4MM, or 1%
Seasonality in comp offset by lower restructuring costs & broad-based expense reduction
Noninterest Expenses
518
($ in millions)
Restructuring
493
53
20
458
461
457
20
11
+ $14MM Salaries & benefits
+ Annual stock comp
+ Higher payroll taxes
+ $4MM 4Q16 Gain on early termination
of certain leased assets
-
-
- $ 9MM Restructuring charges
- $3MM Litigation-related expenses
$2MM Outside processing
$2MM Occupancy
1Q16
2Q16
3Q16
1Q17 compared to 4Q16 Estimated as of 4/18/17
4Q16
1Q17
-
$ 2MM Equipment
-
$2MM FDIC insurance
$2MM Advertising
GEAR Up savings
continue to be on track¹
Comerica Bank
Active Capital Management
Continued to return excess capital to shareholders
2016 CCAR Capital Plan (3Q16-2017)
Increasing Shareholder Payout
Equity repurchases up to $440 million
($ in millions)
$301MM repurchased (5.4MM shares)1 through 1Q17
■Equity Repurchases
Dividends
147
⚫1Q17 $105MM repurchased (1.5MM shares)
137
139
Additional Share Activity in 1Q17
103
42
40
40
79
■ 4.1MM from employee stock activity & warrants exercised
38
•
$24MM tax benefit from employee stock transactions
37
97
99
105
105
■ 2.9MM increase in average diluted shares due to
65
42
employee stock activity & higher stock price
180 million diluted shares at 3/31/17
1Q17 Share Count Up with Stock Price
1Q16
2Q16
3Q16
4Q16 1Q17
Dividends Per Share Growth
(in millions)
■Common Shares Outstanding (PE)
Average Diluted Shares
0.89
0.92
0.83
0.79
192
187
185
0.68
181
177
180
188
0.55
182
179
176
175
177
11
T
2012
2013
2014
2015
2016
2012
2013
2014
2015
2016
1Q17
1Q17
Annualized
3/31/17 1Shares repurchased under equity repurchase program through 3/31/17
Comerica Bank
12View entire presentation