J.P.Morgan Results Presentation Deck
Asset & Wealth Management¹
SELECTED INCOME STATEMENT DATA ($MM)
Revenue
Asset Management
Global Private Bank
Expense
Credit costs
Net income
KEY DRIVERS / STATISTICS ($B)²
Equity
ROE
Pretax margin
Assets under management ("AUM")
Client assets
Average loans
Average deposits
1Q23
$4,784
2,434
2,350
3,091
28
$1,367
1 See note 1 on slide 10
2 Actual numbers for all periods, not over/(under)
JPMORGAN CHASE & CO.
1Q23
$16.0
34%
35
$3,006
4,347
211.5
224.4
$ 0/(U)
4Q22
$196
276
(80)
69
(4)
$233
4Q22
$17.0
26%
33
$2,766
4,048
214.2
237.0
1Q22
$469
120
349
231
(126)
$359
1Q22
$17.0
23%
30
$2,960
4,116
214.6
287.8
CCB
CIB
AWM Corp.
FINANCIAL PERFORMANCE
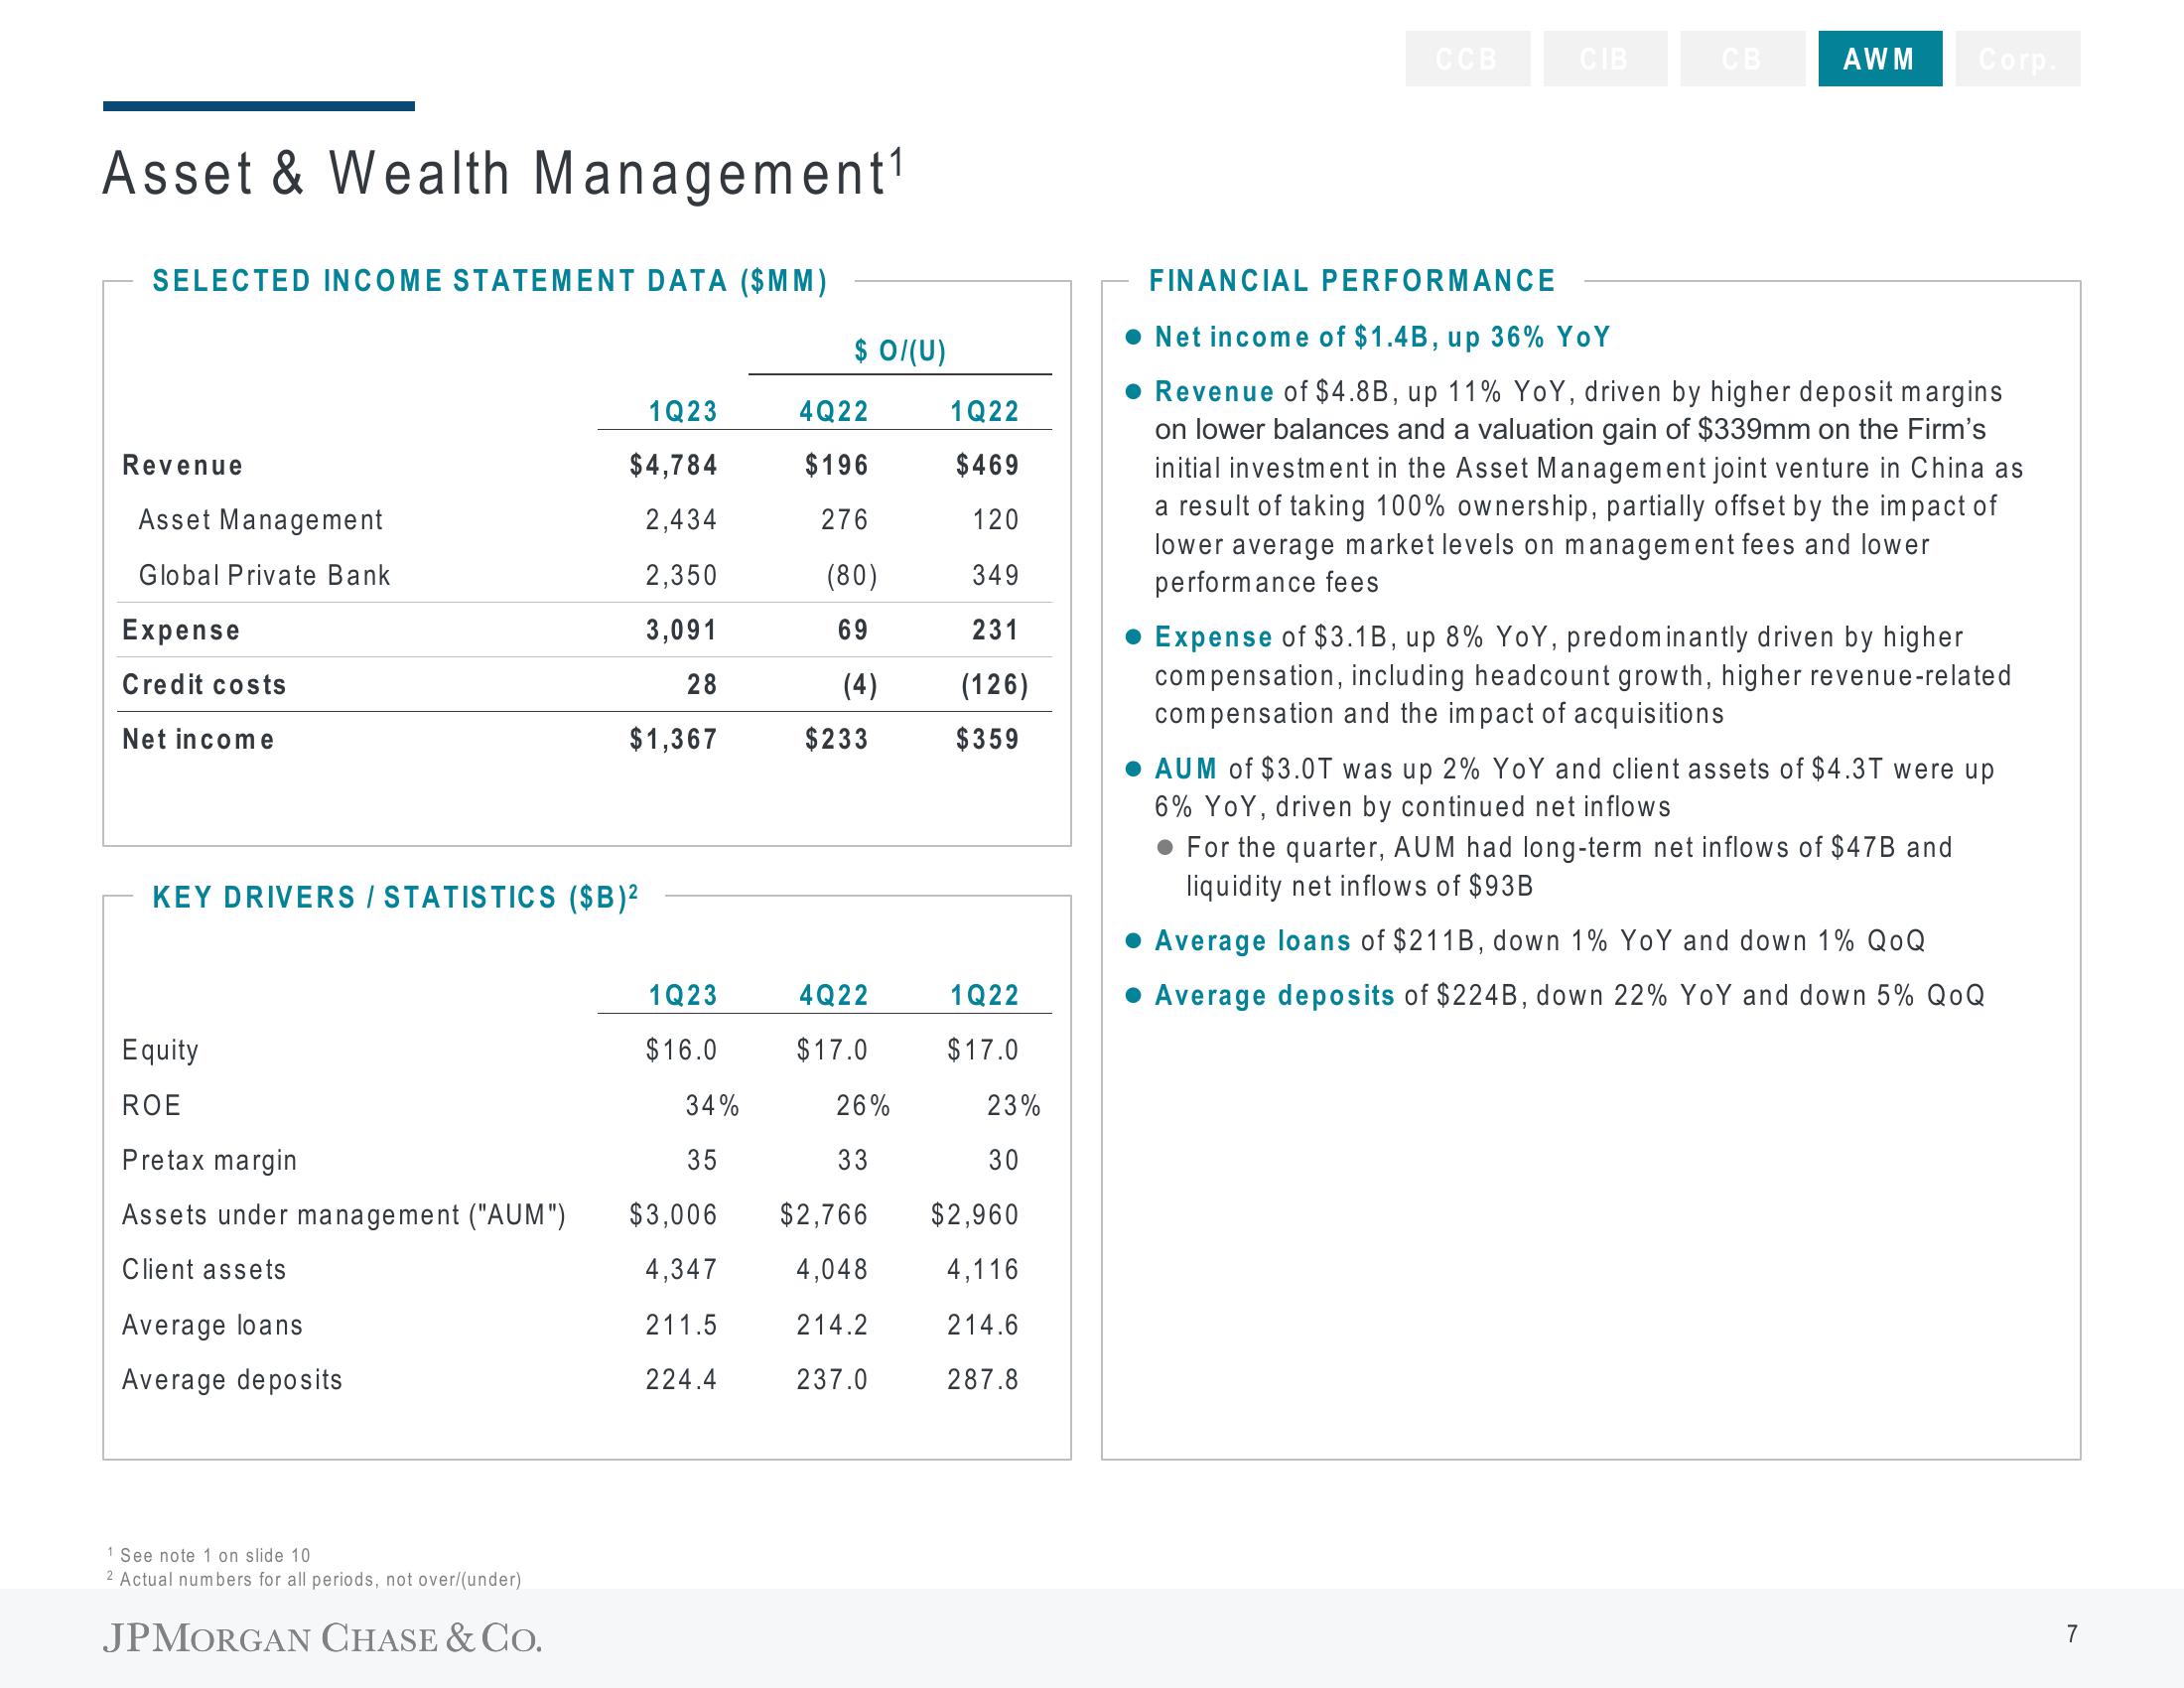
• Net income of $1.4B, up 36% YoY
• Revenue of $4.8B, up 11% YoY, driven by higher deposit margins
on lower balances and a valuation gain of $339mm on the Firm's
initial investment in the Asset Management joint venture in China as
a result of taking 100% ownership, partially offset by the impact of
lower average market levels on management fees and lower
performance fees
• Expense of $3.1B, up 8% YoY, predominantly driven by higher
compensation, including headcount growth, higher revenue-related
compensation and the impact of acquisitions
• AUM of $3.0T was up 2% YoY and client assets of $4.3T were up
6% YOY, driven by continued net inflows
. For the quarter, AUM had long-term net inflows of $47B and
liquidity net inflows of $93B
Average loans of $211B, down 1% YoY and down 1% QOQ
Average deposits of $224B, down 22% YoY and down 5% QOQ
7View entire presentation