Sonos Results Presentation Deck
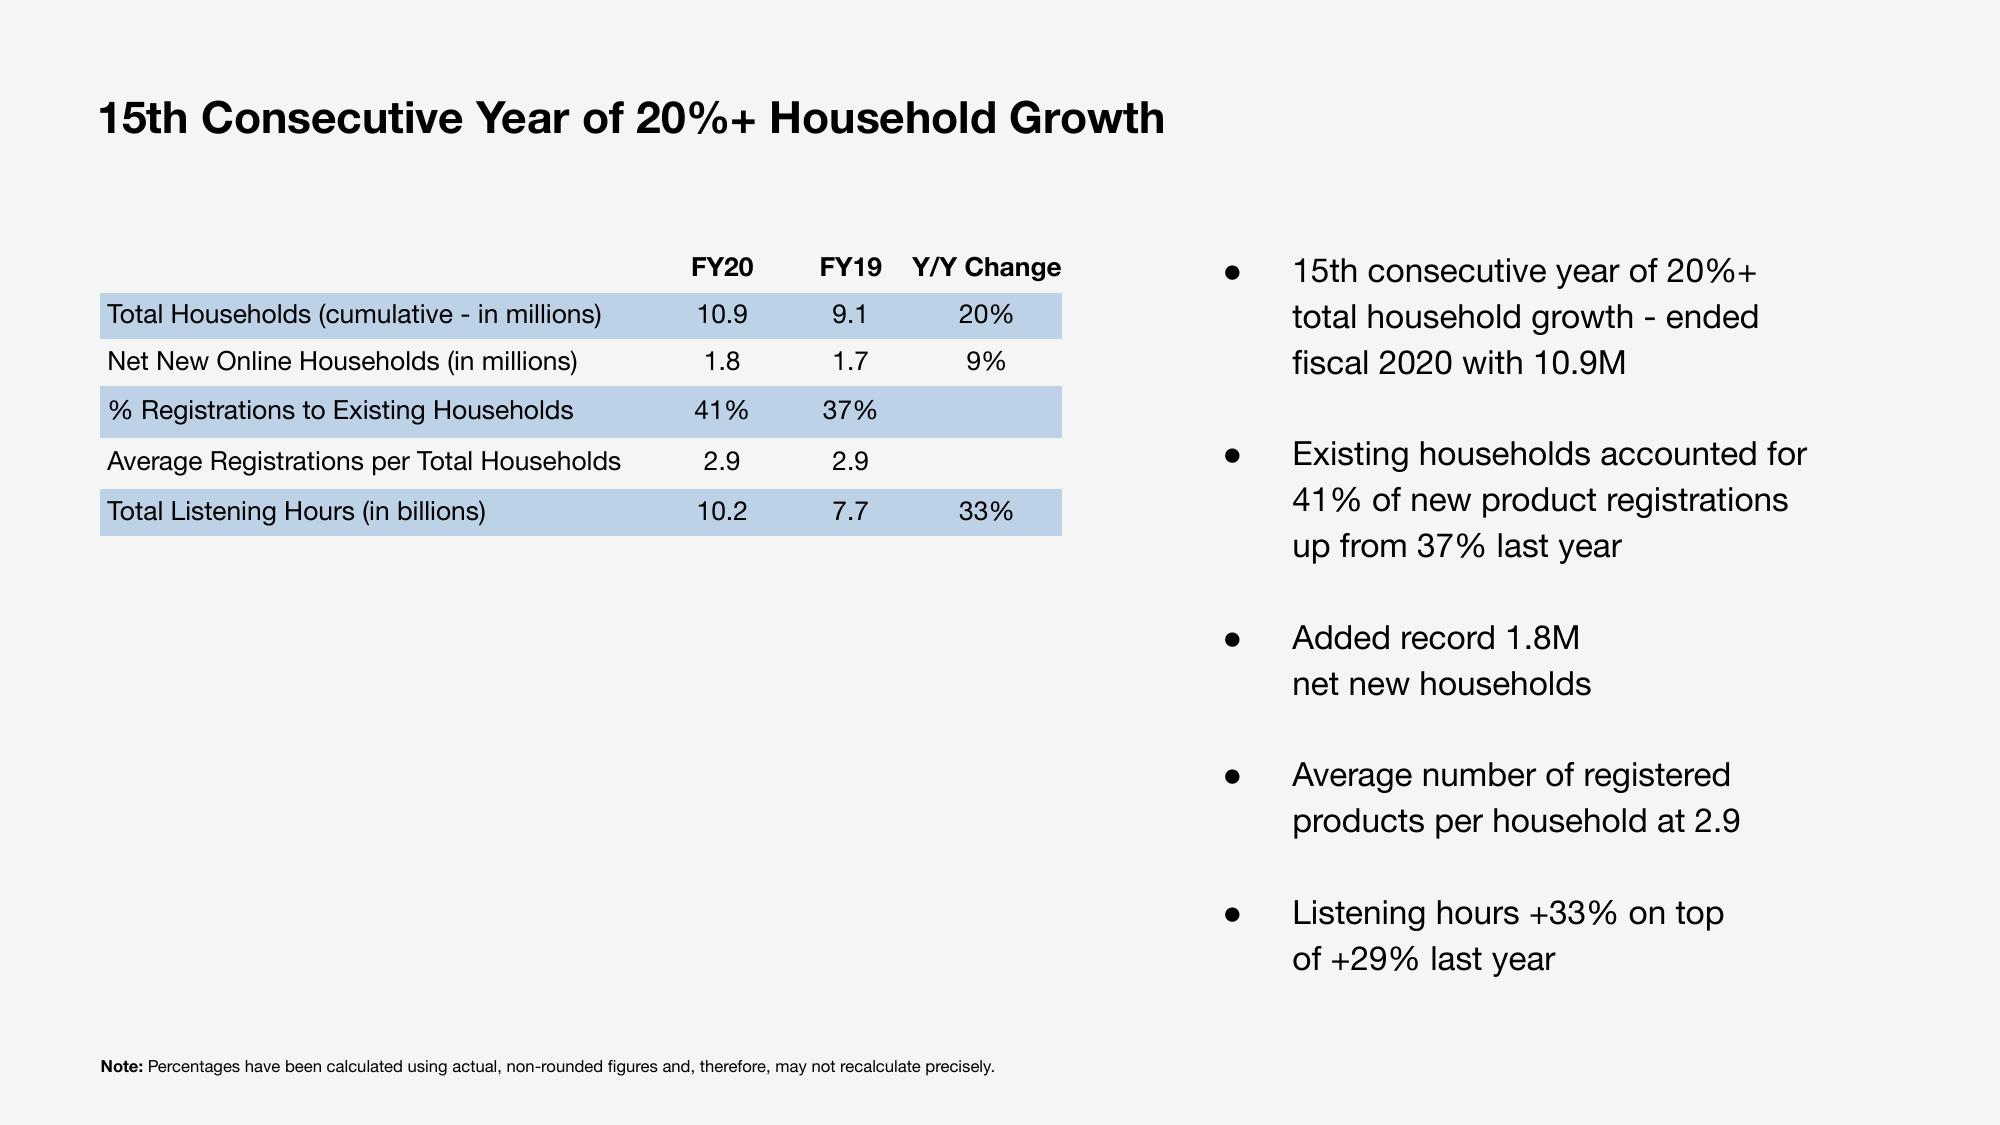
15th Consecutive Year of 20%+ Household Growth
Total Households (cumulative - in millions)
Net New Online Households (in millions)
% Registrations to Existing Households
Average Registrations per Total Households
Total Listening Hours (in billions)
FY20
10.9
1.8
41%
2.9
10.2
FY19
9.1
1.7
37%
2.9
7.7
Y/Y Change
20%
9%
33%
Note: Percentages have been calculated using actual, non-rounded figures and, therefore, may not recalculate precisely.
15th consecutive year of 20%+
total household growth - ended
fiscal 2020 with 10.9M
Existing households accounted for
41% of new product registrations
up from 37% last year
Added record 1.8M
net new households
Average number of registered
products per household at 2.9
Listening hours +33% on top
of +29% last yearView entire presentation