RELX Investor Day Presentation Deck
Case studies: We use data and analytics to advance the SDGs
RELX SDG Graphics
1 htnt
No poverty
-
CENELE
11,323 6,5%
42.4%
3-4
Gend Seal
2.1%
Sams
25.9%
1,07
15
2348291 6.9%
MIMINNE-
2.55
17
Partnership for the goal
141,338 27%
16.
Peace, justice and
111,202
76.35
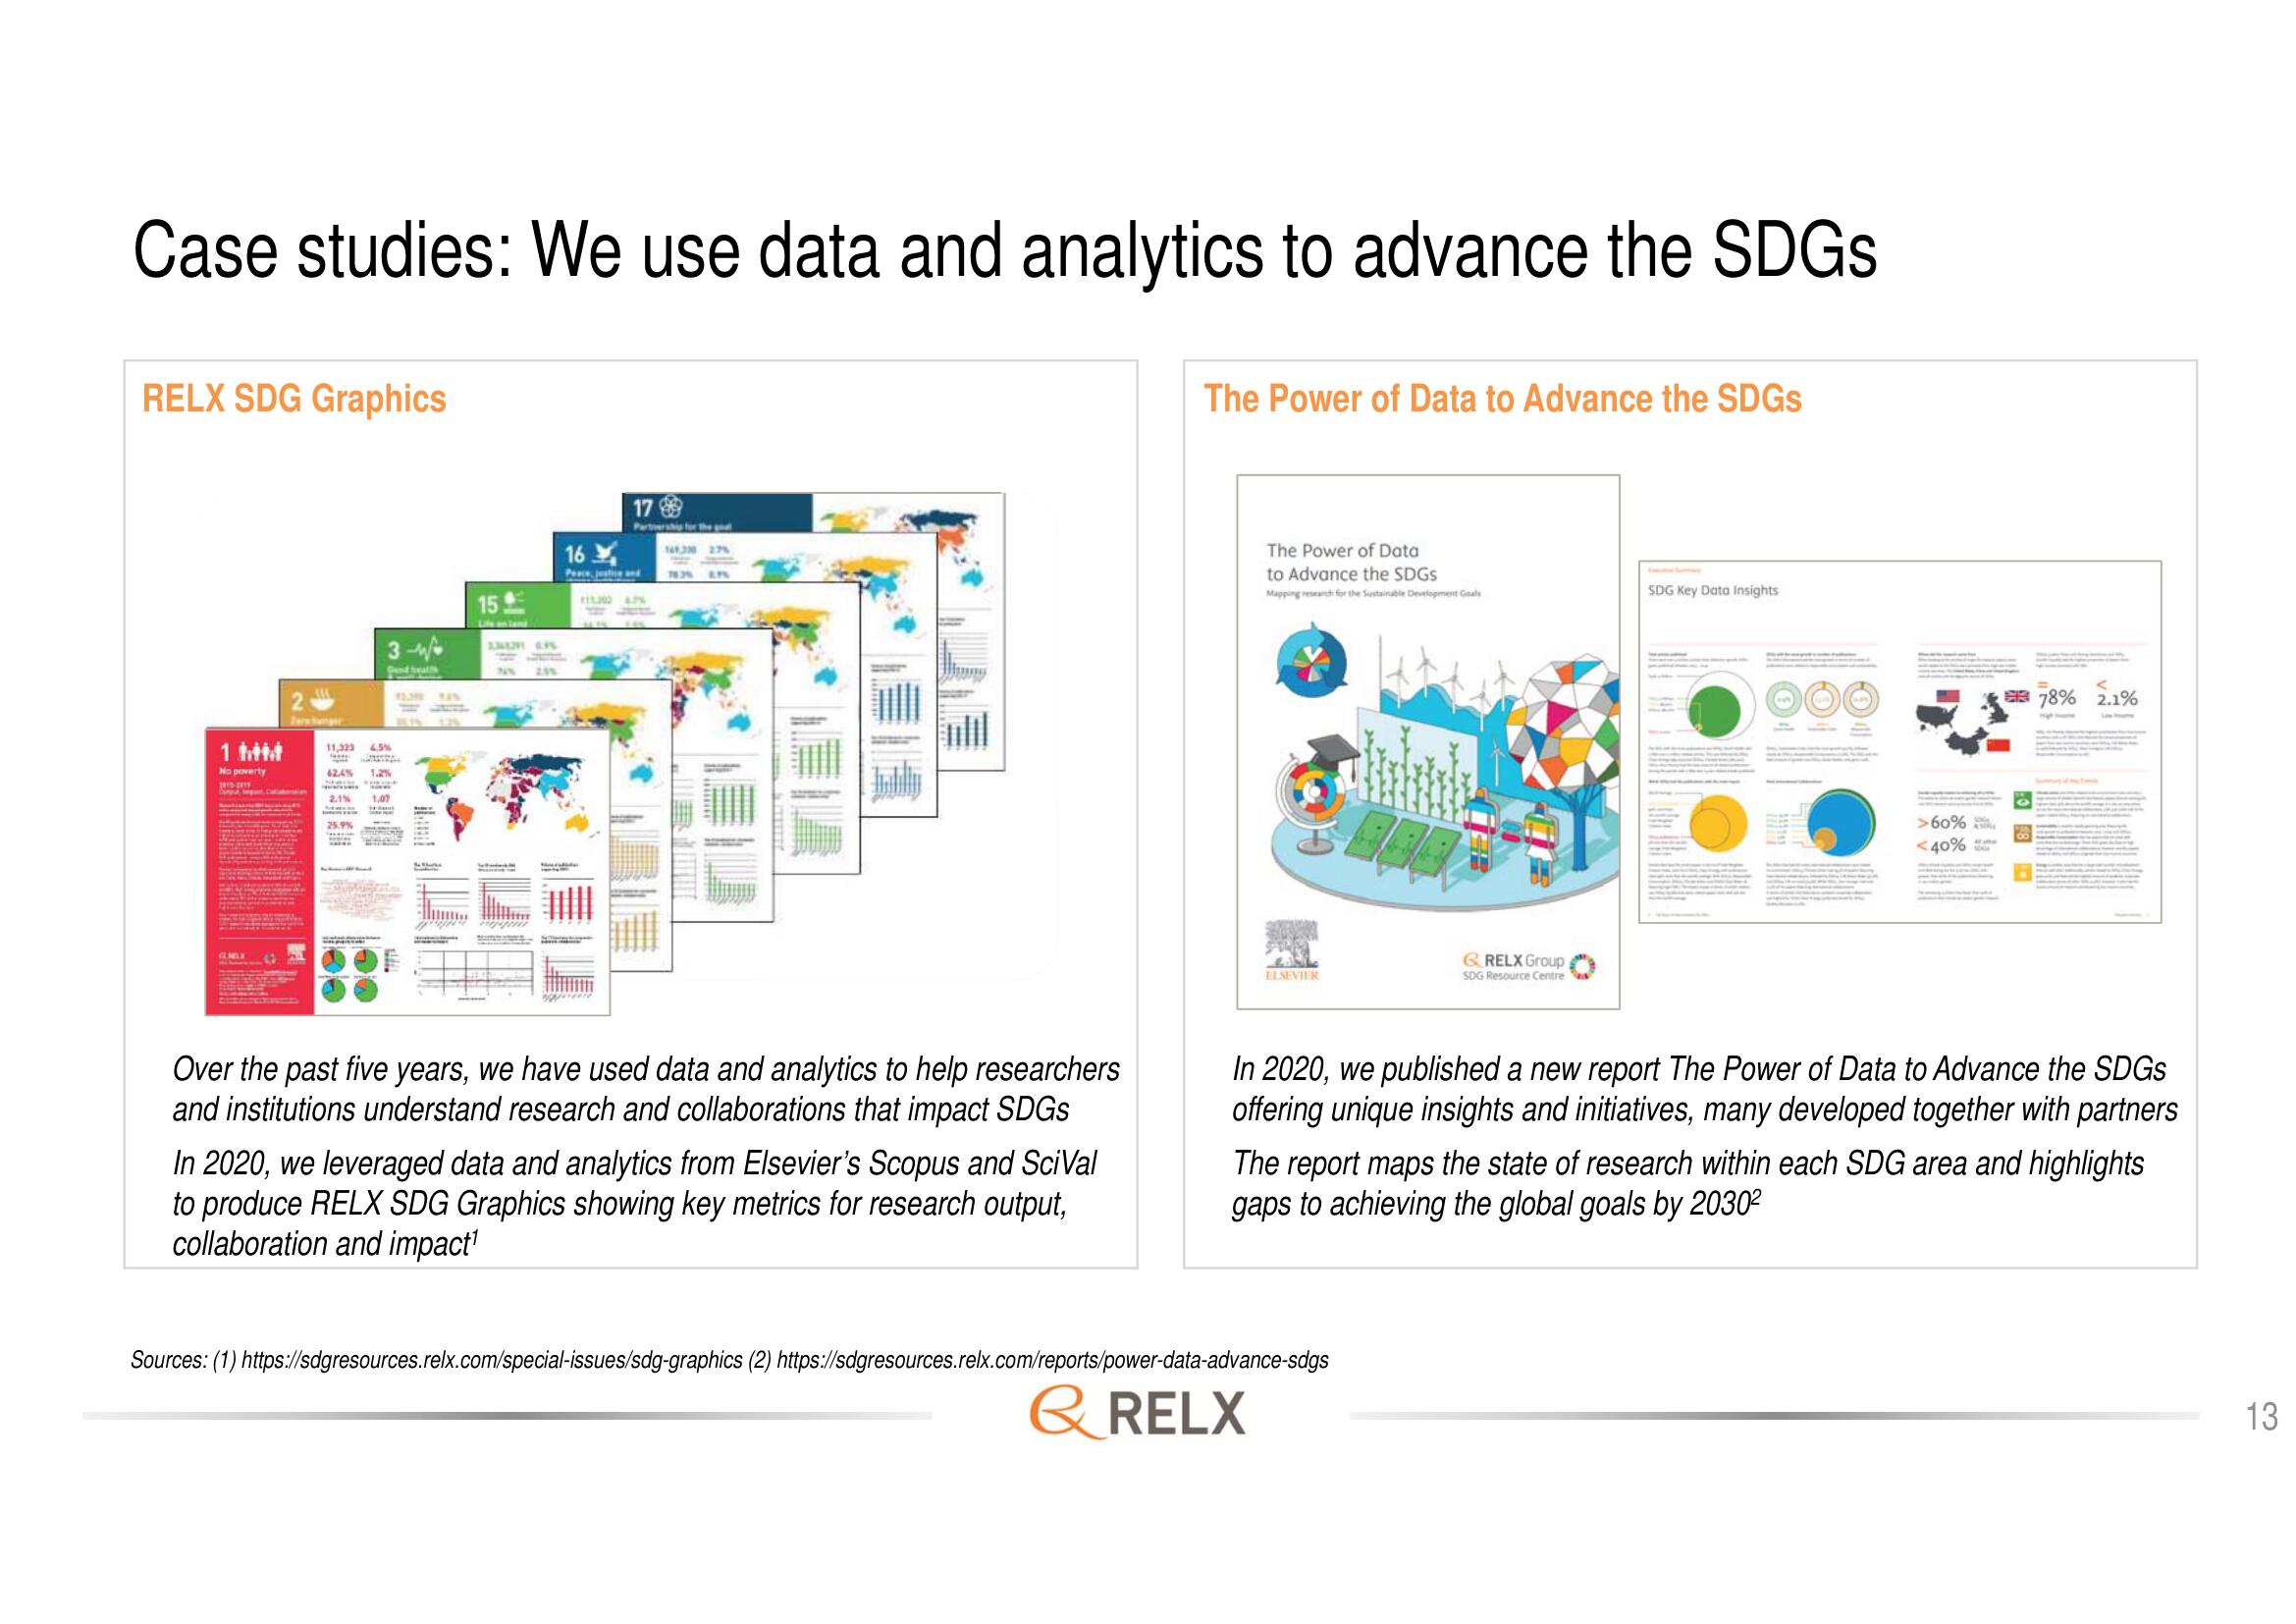
Over the past five years, we have used data and analytics to help researchers
and institutions understand research and collaborations that impact SDGs
In 2020, we leveraged data and analytics from Elsevier's Scopus and SciVal
to produce RELX SDG Graphics showing key metrics for research output,
collaboration and impact¹
The Power of Data to Advance the SDGs
The Power of Data
to Advance the SDGs
Mapping research for the Sustainable Development Goals
LINK
ELSEVIER
& RELX Group
SDG Resource Centre
Sources: (1) https://sdgresources.relx.com/special-issues/sdg-graphics (2) https://sdgresources.relx.com/reports/power-data-advance-sdgs
& RELX
SDG Key Data Insights
(+)
>60%
<40%
78% 2.1%
In 2020, we published a new report The Power of Data to Advance the SDGs
offering unique insights and initiatives, many developed together with partners
The report maps the state of research within each SDG area and highlights
gaps to achieving the global goals by 2030²
13View entire presentation