Bed Bath & Beyond Results Presentation Deck
Q4 BUSINESS & FINANCIAL RESULTS
gross margin expansion driven by key ongoing interventions
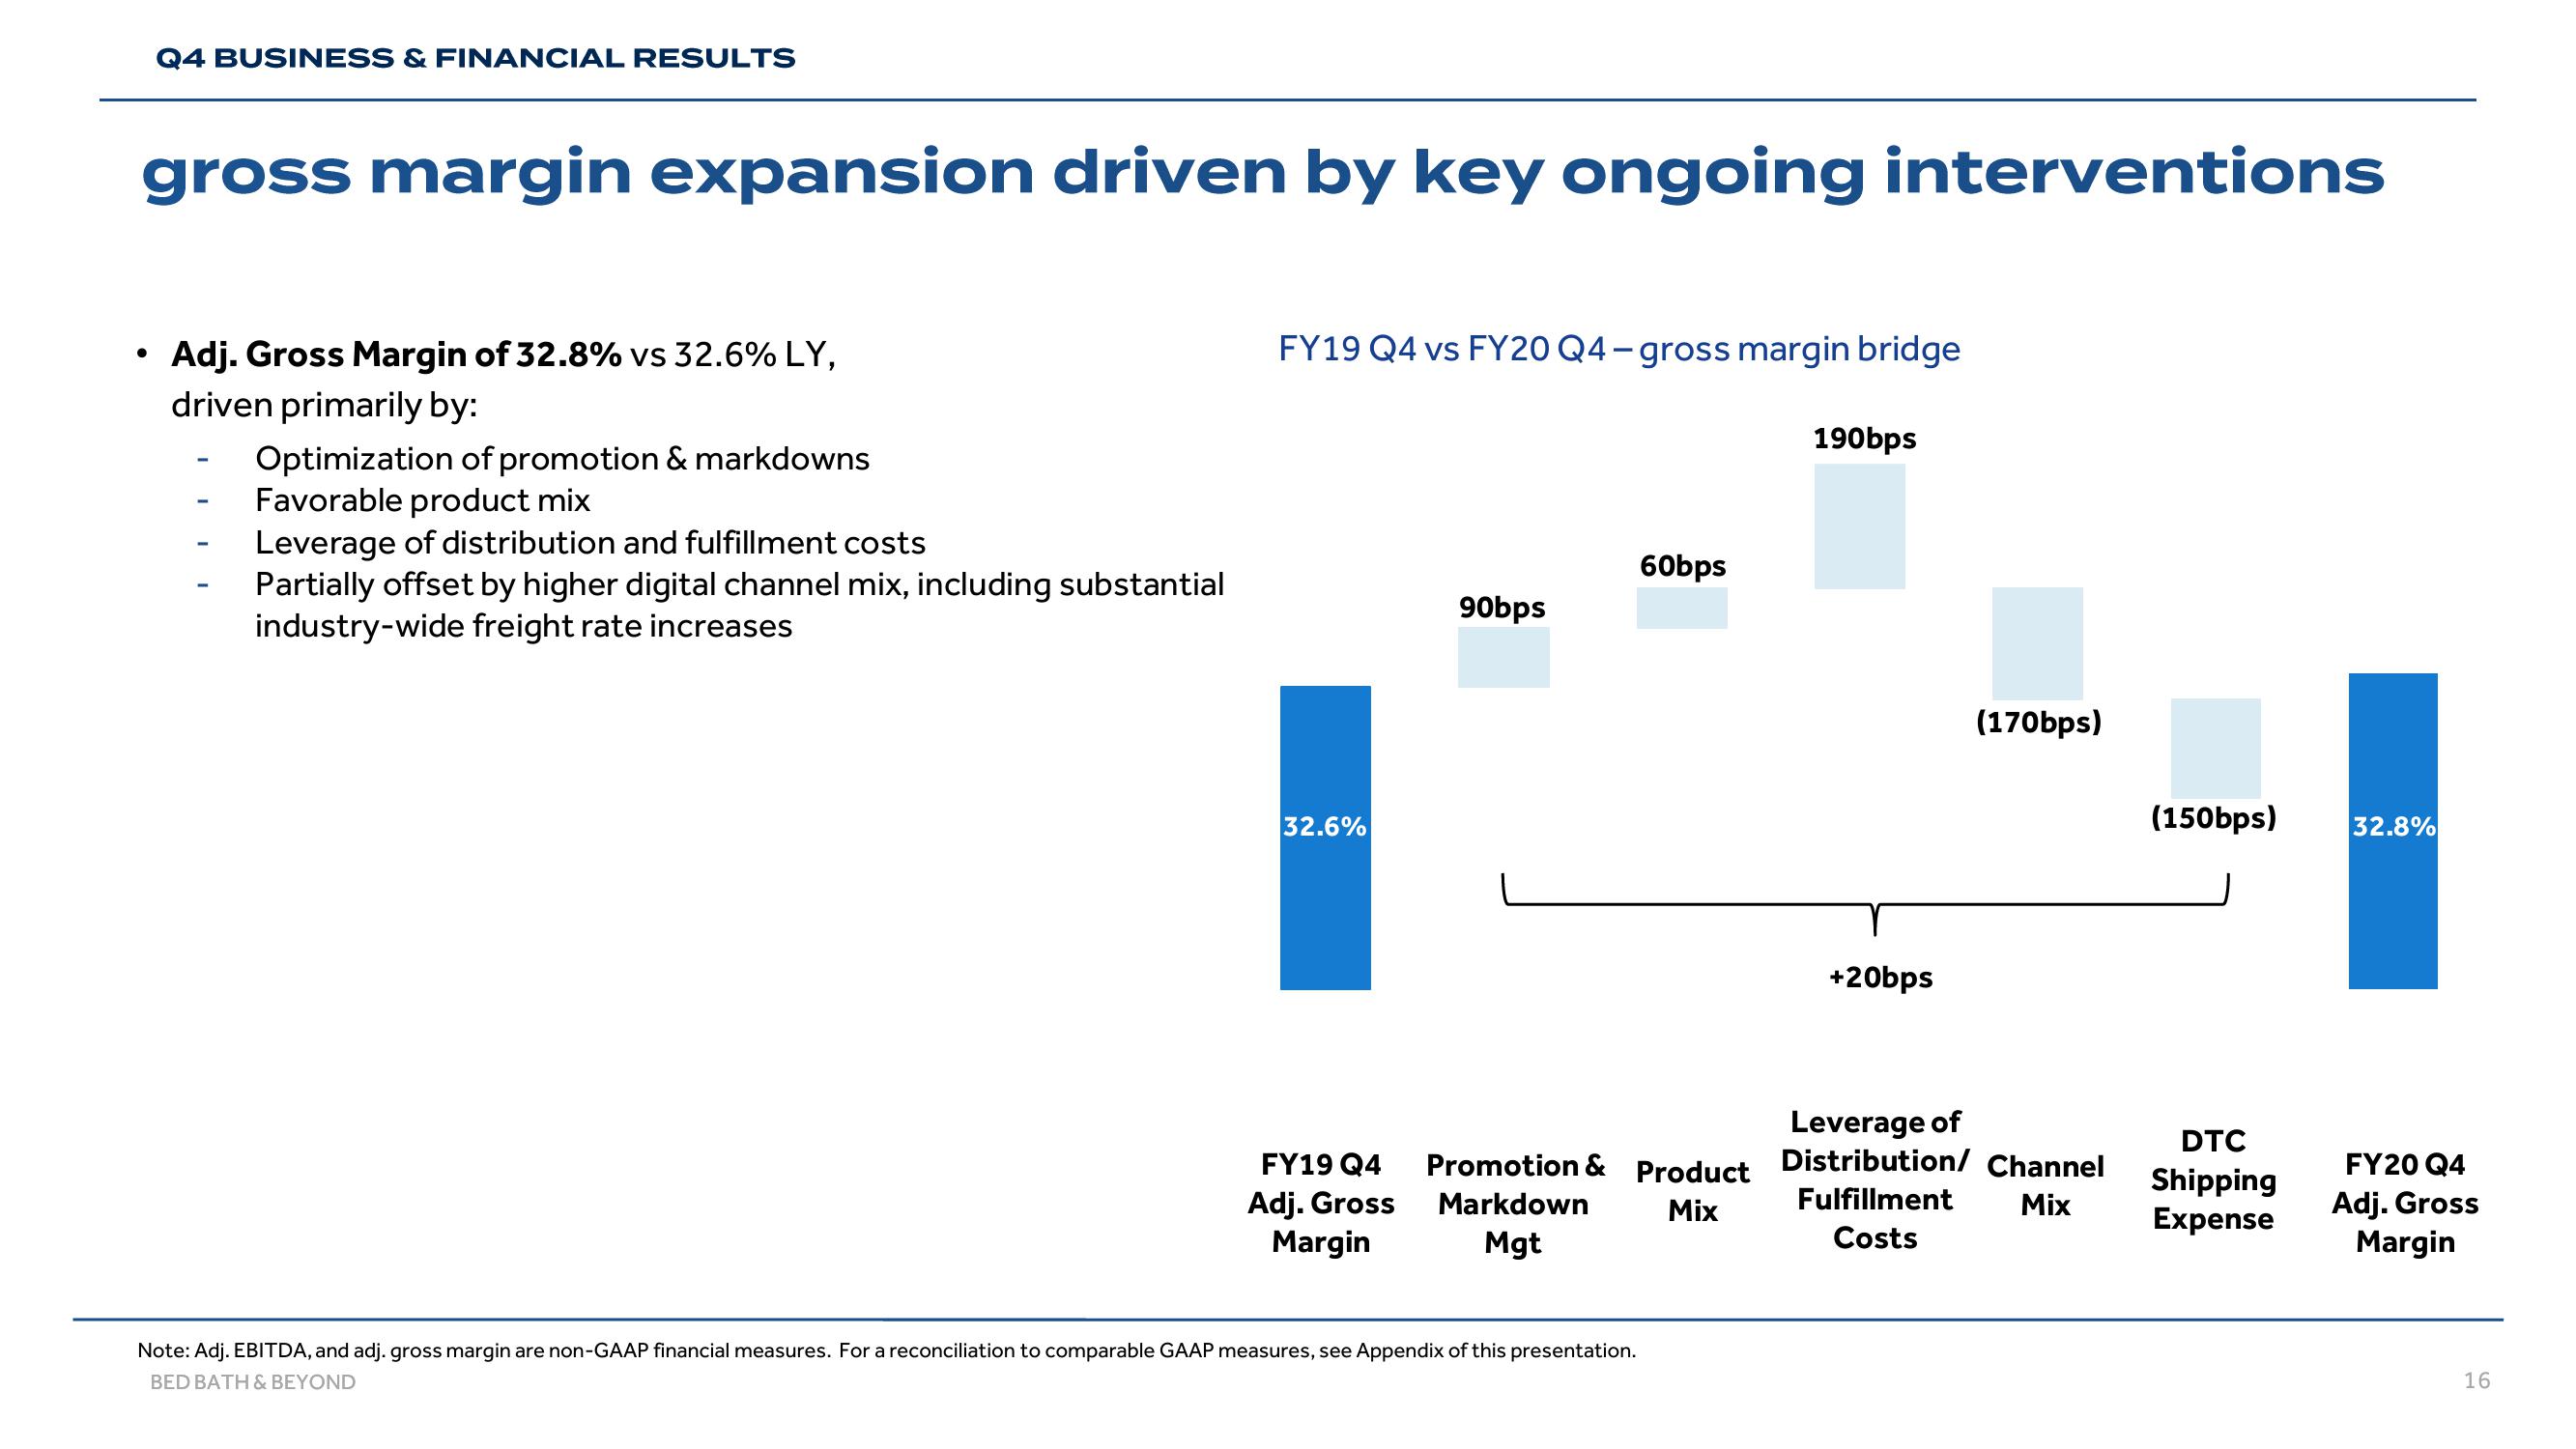
Adj. Gross Margin of 32.8% vs 32.6% LY,
driven primarily by:
-
-
Optimization of promotion & markdowns
Favorable product mix
Leverage of distribution and fulfillment costs
Partially offset by higher digital channel mix, including substantial
industry-wide freight rate increases
FY19 Q4 vs FY20 Q4-gross margin bridge
32.6%
FY19 Q4
Adj. Gross
Margin
90bps
60bps
Promotion & Product
Markdown
Mix
Mgt
Note: Adj. EBITDA, and adj. gross margin are non-GAAP financial measures. For a reconciliation to comparable GAAP measures, see Appendix of this presentation.
BED BATH & BEYOND
190bps
+20bps
(170bps)
Leverage of
Distribution/ Channel
Fulfillment
Mix
Costs
(150bps)
DTC
Shipping
Expense
32.8%
FY20 Q4
Adj. Gross
Margin
16View entire presentation