J.P.Morgan 2Q23 Investor Results
JPMORGAN CHASE & CO.
CREDIT-RELATED INFORMATION, CONTINUED
(in millions, except ratio data)
SUMMARY OF CHANGES IN THE ALLOWANCES
ALLOWANCE FOR LOAN LOSSES
Beginning balance
Net charge-offs:
Gross charge-offs
Gross recoveries collected
Net charge-offs
Provision for loan losses
Other
Ending balance
ALLOWANCE FOR LENDING-RELATED COMMITMENTS
Beginning balance
Provision for lending-related commitments
Other
Ending balance
ALLOWANCE FOR INVESTMENT SECURITIES
Total allowance for credit losses (a)
NET CHARGE-OFF/(RECOVERY) RATES
Consumer retained, excluding credit card loans
Credit card retained loans
Total consumer retained loans
Wholesale retained loans
Total retained loans
Memo: Average retained loans
Consumer retained, excluding credit card loans
Credit card retained loans
Total average retained consumer loans
Wholesale retained loans
Total average retained loans
$ 20,053
$
$
$
2Q23
$
1,776
(365)
1,411
3,317 (b)
21
21,980
2,370
(188) (b)
4
2,186
104
$ 24,270
0.14%
2.41
0.91
0.10
0.47
$ 359,543
187,027
546,570
647,474
$1,194,044
$
$
$
$
$
1Q23
19,139 (c) $
1,451
(314)
1,137
2,047
4
20,053
2,382
(13)
1
2,370
90
$ 22,513
0.18%
2.07
0.89
0.06
0.43
$ 300,585
180,451
481,036
601,401
$1,082,437
$
$
$
$
4Q22
18,185
1,210
(323)
887
2,426
2
19,726
2,551
(169)
2,382
96
$ 22,204
QUARTERLY TRENDS
0.16%
1.62
0.70
0.03
0.33
$ 301,093
177,026
478,119
599,817
$1,077,936
$ 17,750
$
$
$
$
3Q22
$
1,104
(377)
727
1,165
(3)
18,185
2,222
328
1
2,551
61
20,797
0.10 %
1.40
0.56
0.04
0.27
$ 301,347
168,125
469,472
590,490
$1,059,962
$
$
2Q22
$
17,192
1,036
(15)
$ 17,750
(379)
657
1,230
2,358
(135)
(1)
2,222
47
$ 20,019
0.04%
1.47
0.53
0.03
0.25
$ 299,649
158,434
458,083
577,850
$1,035,933
2Q23 Change
1Q23
5%
22
(16)
24
62
425
10
(1)
NM
300
(8)
16
8
20
4
14
8
10
JPMORGAN CHASE & Co.
2Q22
17 %
71
4
115
170
NM
24
1
(39)
NM
(2)
121
21
20
18
19
12
15
$
2023
$
19,139
3,227
(679)
2,548
5,364
25
$ 21,980
$
$ 2,382
(201)
5
2,186
104
SIX MONTHS ENDED JUNE 30,
$ 24,270
0.16%
2.25
0.90
0.08
0.45
$ 330,227
183,757
513,984
624,566
$1,138,550
(b)
(b)
$
$
$
$
$
$
2022
16,386
2,012
(773)
1,239
2,598
5
17,750
2,261
(39)
2,222
47
20,019
0.05%
1.42
0.52
0.03
0.24
$ 297,566
153,941
451,507
568,673
$1,020,180
2023 Change
2022
17%
60
12
106
106
400
24
5
(415)
NM
(2)
121
21
11
19
14
10
12
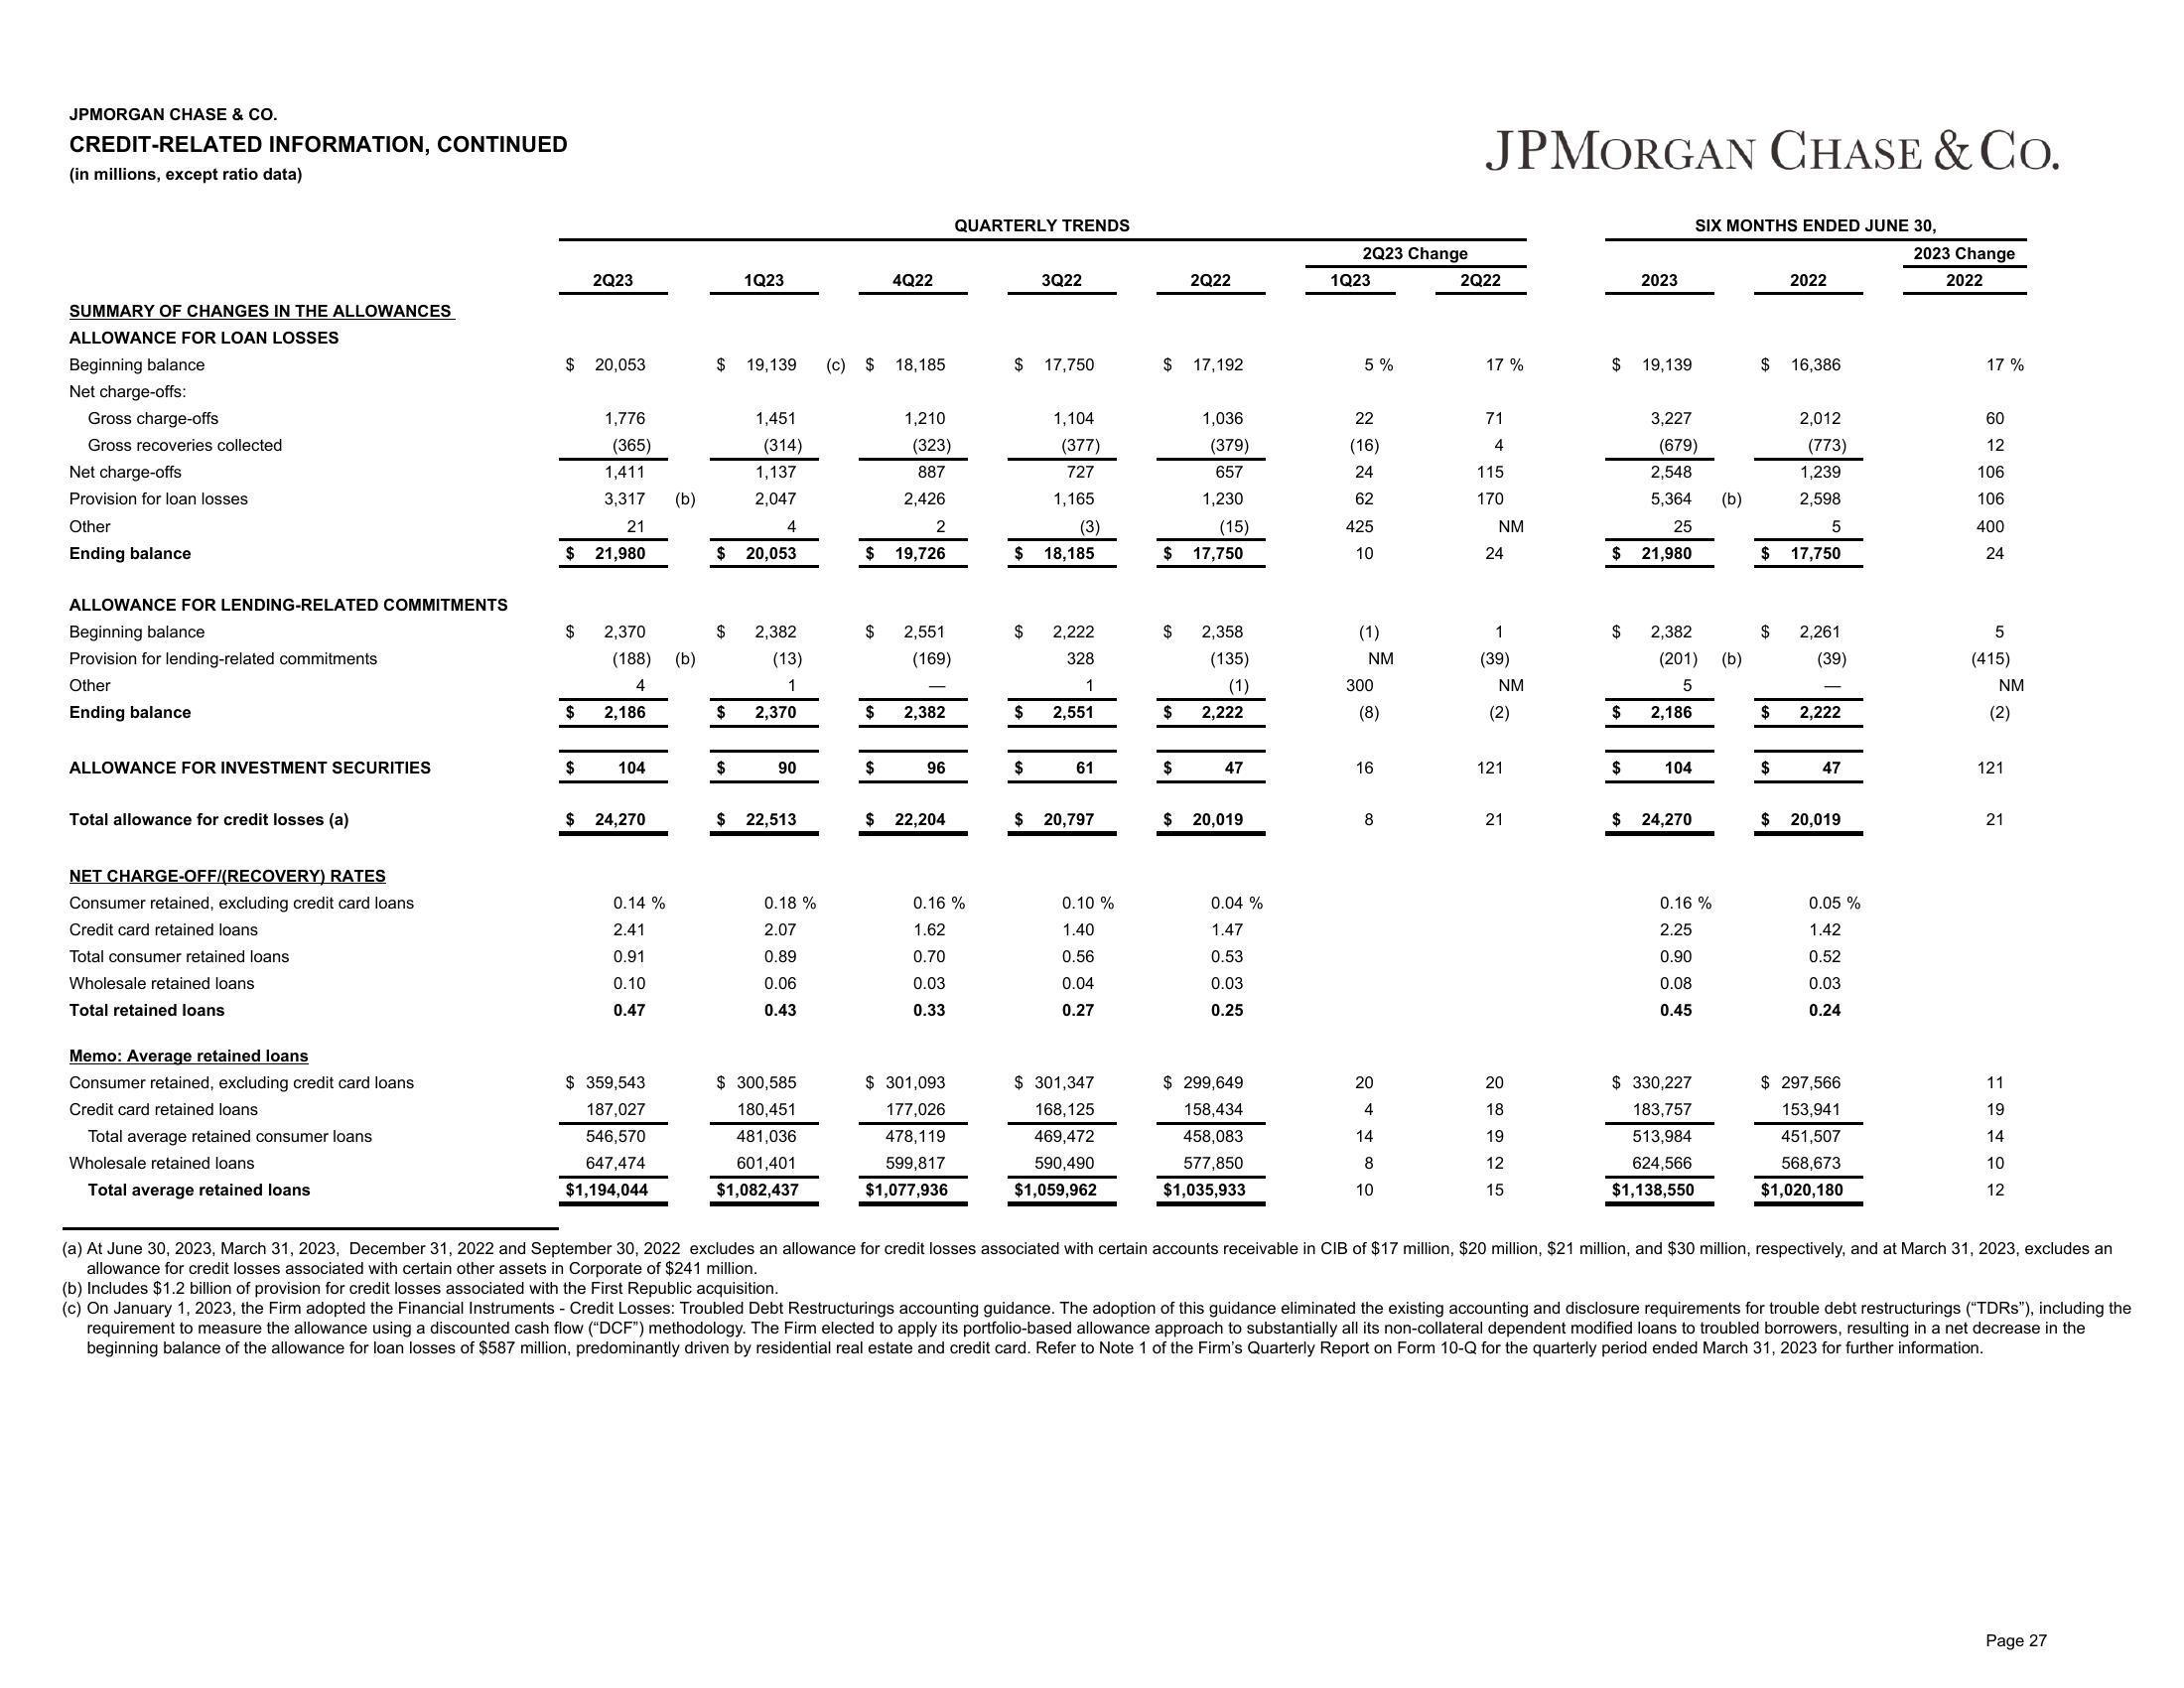
(a) At June 30, 2023, March 31, 2023, December 31, 2022 and September 30, 2022 excludes an allowance for credit losses associated with certain accounts receivable in CIB of $17 million, $20 million, $21 million, and $30 million, respectively, and at March 31, 2023, excludes an
allowance for credit losses associated with certain other assets in Corporate of $241 million.
(b) Includes $1.2 billion of provision for credit losses associated with the First Republic acquisition.
(c) On January 1, 2023, the Firm adopted the Financial Instruments - Credit Losses: Troubled Debt Restructurings accounting guidance. The adoption of this guidance eliminated the existing accounting and disclosure requirements for trouble debt restructurings ("TDRs"), including the
requirement to measure the allowance using a discounted cash flow ("DCF") methodology. The Firm elected to apply its portfolio-based allowance approach to substantially all its non-collateral dependent modified loans to troubled borrowers, resulting in a net decrease in the
beginning balance of the allowance for loan losses of $587 million, predominantly driven by residential real estate and credit card. Refer to Note 1 of the Firm's Quarterly Report on Form 10-Q for the quarterly period ended March 31, 2023 for further information.
Page 27View entire presentation